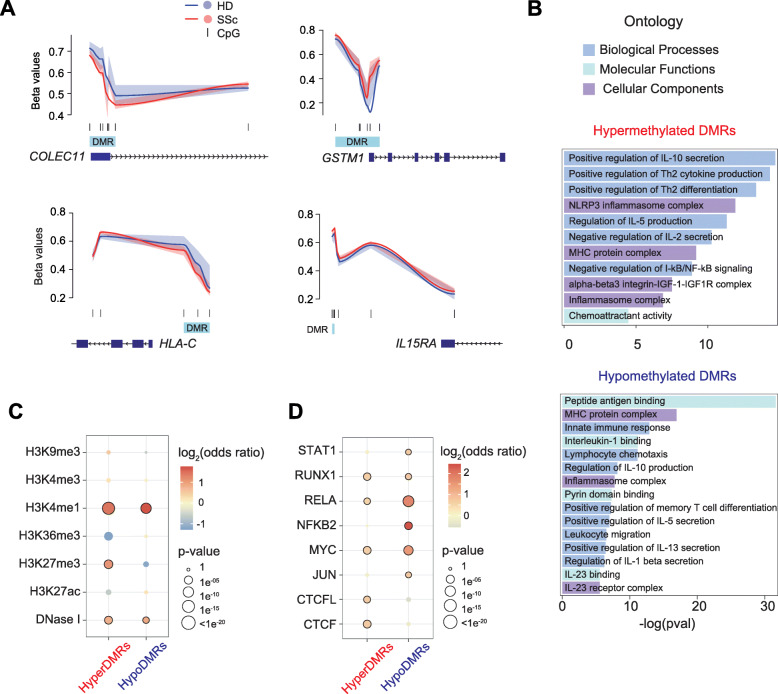
Fig. 2.
Differentially methylated regions (DMRs) enrich in inflammatory loci and pro-inflammatory transcription factors. a Graphical representation of beta values of identified DMRs, utilizing bumphunter tool, mapped to relevant genes, including COLEC11, GSTM1, HLA-C, and IL15RA. Identified DMRs are highlighted in blue, and CpGs are depicted in black. Lines represent locally estimated scatterplot smoothing, and transparent areas represent confidence intervals. b GO analysis of hyper- and hypomethylated DMRs utilizing the GREAT online tool. DMRs were mapped to the nearest gene. c Enrichment of DNase I hypersensitivity, H3K9me3, H3K4me3, H3K4me1, H3K36me3, H3K27me3, and H3K27ac ChIP-seq data, obtained from the BLUEPRINT portal, in hyper- and hypomethylated DMRs. d Enrichment of TF ChIP-seq peaks in hyper- and hypomethylated DMRs. ChIP-seq data were downloaded from ReMap database, in which STAT1, RUNX1, NFKB2, MYC, JUN, CTCFL, and CTCF were downloaded as consolidated ChIP-seq peaks of all available datasets, whereas RELA ChIP-seq peaks were obtained from CD4+ T cells. c, d Background of the same length as DMRs was generated from EPIC array, in which 1000 resamplings were applied. p values and odds ratios are averages of 1000 permutations. Highlighted circles represent statistically significant comparisons (p value < 0.01 and odds ratio > 1) compared to background

