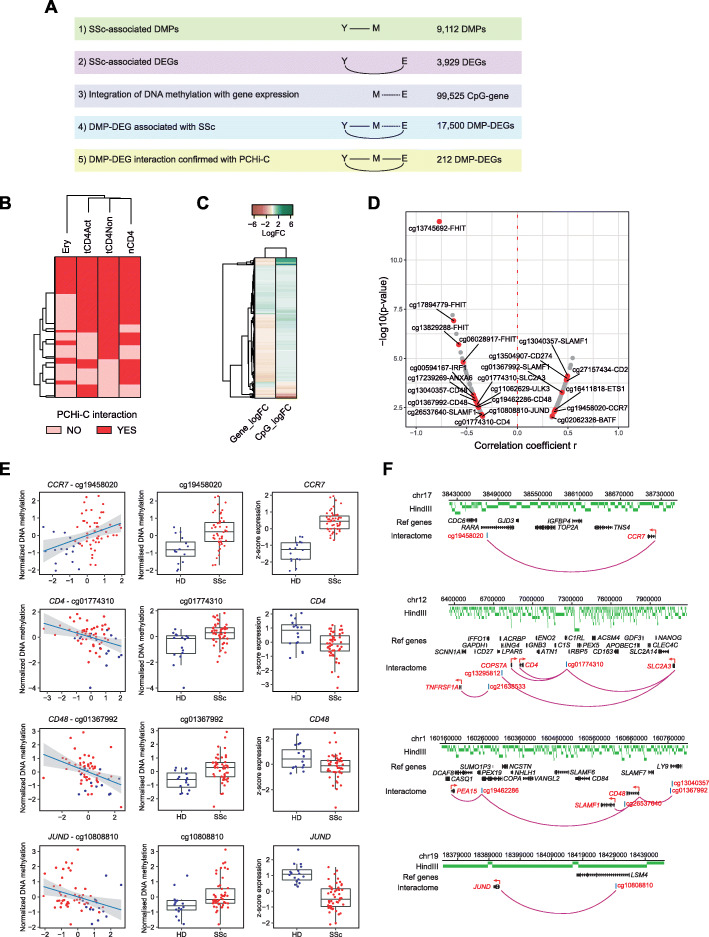
Fig. 5.
Long-range interactions identified by promoter capture Hi-C (PCHi-C). a Correlations of possible long-range interactions between DMPs and DEGs were detected using the MatrixEQTL package by applying a maximum interaction distance of 5 Mb with a Pearson p value cutoff of 0.01. Overview summarizing multistep filtering process based on the causal inference test. Y, SSc phenotype; M, identified DMPs; E, identified DEGs; S, SSc-associated susceptibility loci. b Heatmap showing the presence (red) or absence (pink) of promoter capture Hi-C (PCHi-C) interactions of 212 identified DMP-DEGs identified utilizing naïve (nCD4), non-activated (tCD4Non), and activated (tCD4Act) PCHi-C datasets. The presence or absence of the same interactions was interrogated in erythroblasts (Ery). c Heatmap of log2FC of gene expression and DNA methylation of the 212 confirmed interacting DMP-DEGs. d Volcano plot of the 212 confirmed DMP-DEG interactions. Correlation coefficient r of DNA methylation and gene expression values is plotted on the x-axis against −log10(p value) on the y-axis. Genes relevant to T cell biology are highlighted in red. e Graphical representations of DMP-DEG pairs with significant correlation between DNA methylation and gene expression (Pearson p value < 0.01). f Overlap between DMP-DEG pairs and PCHi-C data was performed to confirm long-range interactions. Arc plot of long-distance interactions between DMPs and DEGs as confirmed by PCHi-C, in which confirmed interactions are depicted as purple arcs. HindIII fragments are depicted in green, and interacting genes and CpGs are highlighted in red

