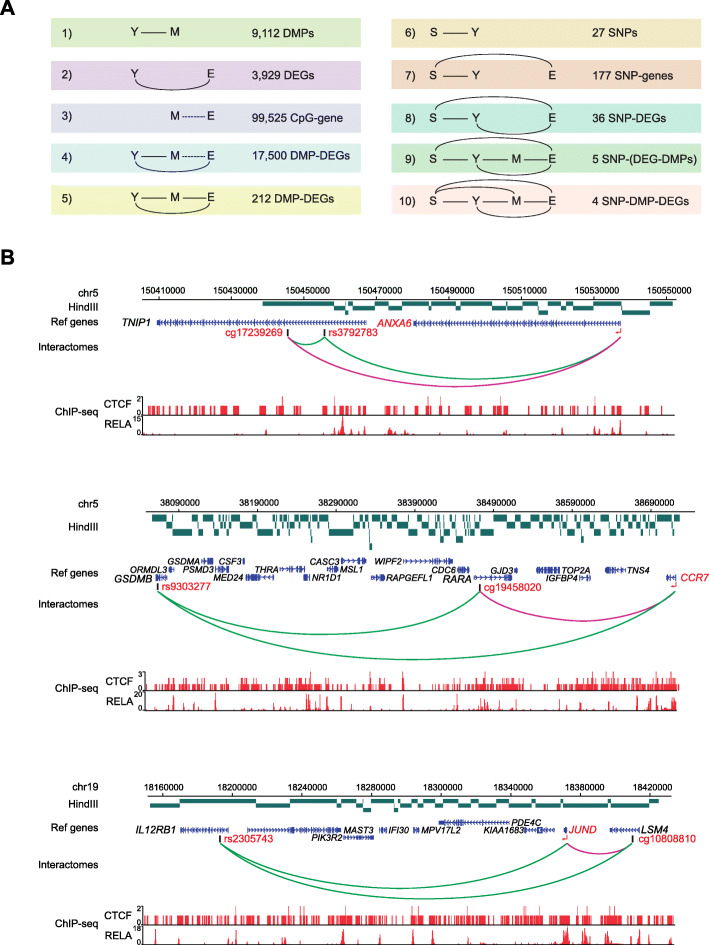
Fig. 6.
Presence of SSc-associated genetic variants associated with PCHi-C-identified DMP-DEG interactomes. a Multistep filtering process based on the causal inference test extended from Fig. 5, summarizing the filtering steps adopted to identified four interactomes involving SSc-associated SNPs, DMPs, and DEGs. Y, SSc phenotype; M, identified DMPs; E, identified DEGs; S, SSc-associated susceptibility loci. b Arcs in green represent interactions of SSc-associated SNPs with distant genes, as confirmed by López-Isac et al. [15], and arcs in purple represent DMP-DEG interactions identified and confirmed in this study. HindIII fragments are depicted in green, and interacting genes and CpGs are highlighted in red. Density plots represent ChIP-seq data of RELA and CTCF. ChIP-seq data were downloaded from ReMap database, in which CTCF were downloaded as consolidated ChIP-seq peaks of all available datasets, whereas RELA ChIP-seq peaks were obtained from CD4+ T cells

