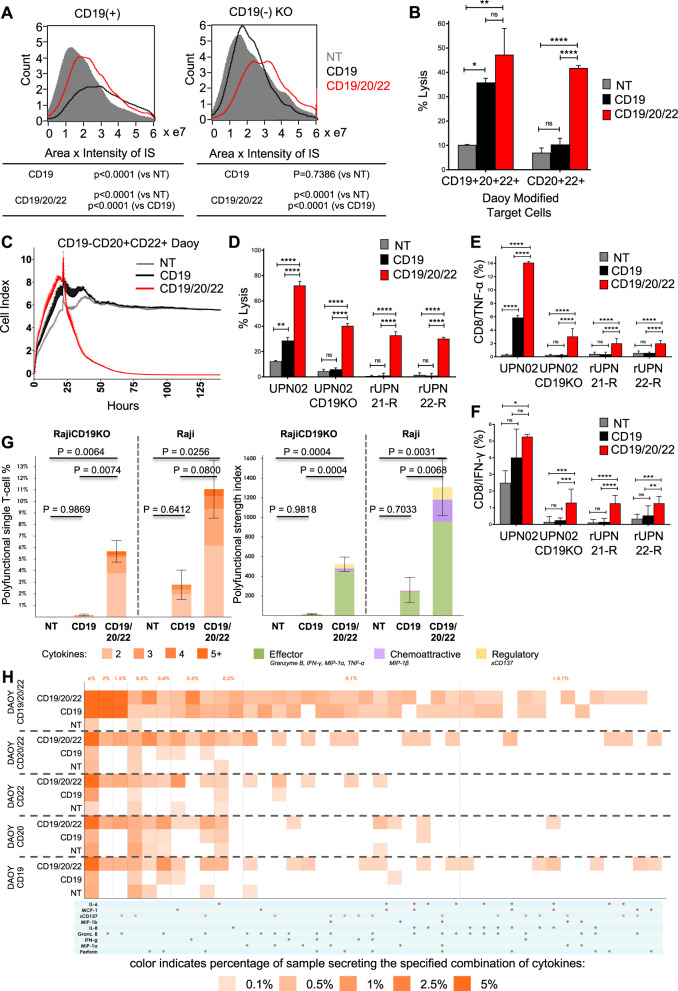
Fig. 4. Trivalent CAR T-cells overcome CD19(−) antigen escape in primary BL-ALL.
a Image stream analysis was performed as described in Fig. 3. The area × intensity of phalloidin in the CARIS is quantified for NT, CD19CAR, and CD19/20/22CAR T-cells in their interaction with CD19-expressing and CD19 KO target cells. b Eight hours 51Cr release assay targeting cells over-expressing CD19, CD20, and CD22 (triple positive) or CD20 and CD22 (double positive) cells at an E:T ratio of 5:1 (n = 2). c Long-term impedance-based xCELLigence killing assay targeting double positive (CD20+CD22+) but CD19- cells that are described in Fig. S2B. Target cells were cultured for ~24 h before NT, CD19CAR, or CD19/20/22CAR T-cells were added in a 1:3 E:T ratio. Tumor cell lysis, represented by a decrease in cell index, was measured over time (n = 2). d Target BL-ALL cells (UPN02, UPN02 CD19KO, rUPN21-R, rUPN22-R) were cocultured with NT or CAR T-cells at an E:T ratio of 3:1 for 4 h and cell lysis was determined by 51Cr assay (data shown are representative data, n = 3). **p < 0.01, ****p < 0.0001, one-way ANOVA with Tukey’s multiple comparison post-test. BL-ALL target cells (UPN02, UPN02 CD19KO, rUPN21-R, rUPN22-R) were cocultured with T-cells in the presence of brefeldin A at an E:T ratio of 10:1 for 4 h. Cells were stained to determine levels of intracellular (e) TNF-α + CD8 + T-cells or (f) IFN-γ + CD8+T-cells. NT T-cells serve as a negative control in all experiments (n = 3). **p < 0.01, ***p ≤ 0.001, ****p < 0.0001, one-way ANOVA with Tukey’s multiple comparison post-test. (g–h) CD19+ and CD19- target cells were cocultured with CD8+ isolated CD19/20/22CAR, CD19CAR, and NT T-cells, and single-cell polyfunctionality assessed via a 32-plex antibody barcoded chip analysis. (g) Polyfunctionality evaluation of the number and subset classification of cytokines produced by single cells in response to antigen-specific stimulation (h) Single-cell functional heatmap demonstrates proportions of polyfunctional subsets of T-cells in response to Daoy cells transduced with various combinations of tumor antigens. Each column corresponds to a specific cytokine or combination of cytokines, and the orange squares represent the frequency at which the cytokine set was secreted by the corresponding sample. The cytokine groups are ordered by overall frequency across all samples.

