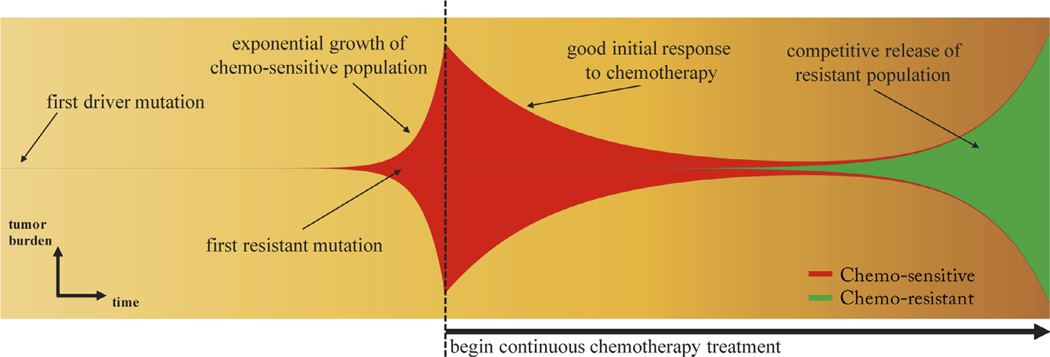
Fig. 2. Clonal evolution of competitive release.
– A fishplot (sometimes known as a Müller plot), showing the tumor quantity (vertical axis) and composition (sensitive: red; resistant: green) over time (horizontal axis, left to right) with important events annotated. After first driver mutation (left), initial exponential growth of sensitive population occurs until diagnosis (dashed line). Continuous therapy targeting the chemo-sensitive population responds well with a decrease in tumor burden. In the absence of sensitive cells, the resistant population (existing in small numbers before the start of therapy) grows to become the dominant subpopulation at relapse, albeit typically with lower exponential growth rate due to the cost of resistance.

