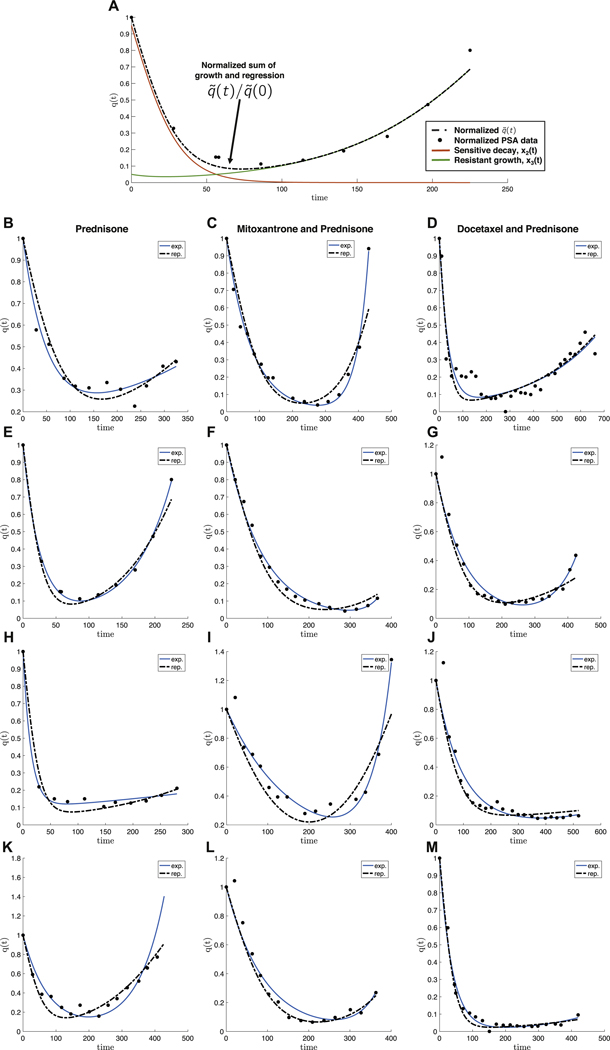
Fig. 3. Model fits of PSA measurement data for metastatic castration-resistant prostate cancer.
– Prostate-specific antigen (PSA) measurement data of four representative patients from three randomised clinical trials with metastatic castration-resistant prostate cancer. (A) A single patient data shown with model fit Eq. (4) of growing resistant population (green), decaying sensitive population (red), where the sum represents an overall initial good response and eventual relapse (q(t), dashed line). Left column: treatment with prednisone only Michaelson et al. (2013); middle column: treatment with mitoxantrone and prednisone Tannock et al. (2004); right column: treatment with docetaxel and prednisone Petrylak et al. (2015). PSA data is normalized by q(t = 0) (black dots). The data is fit using the exponential model (Eq. (1); blue curve) and the replicator model (Eqs. (2) and (3)). Each patient is fit reasonably well with both models. Data was fit by parameter sweep of cost (α − β, Eqs. (15) and (16), initial fractional resistance f and selection pressure w. Parameters used are α − β = [0.02, 0.07, 0.20, 0.00, 0.20, 0.00, 0.20, 0.03, 0.20, 0.01, 0.15, 0.19]; f = [0.20, 0.02, 0.09, 0.05, 0.03, 0.07, 0.10, 0.10, 0.09, 0.10, 0.03, 0.03]; w = [0.10, 0.20, 0.20, 0.30, 0.20, 0.10, 0.30, 0.15, 0.10, 0.15, 0.20, 0.20] for B − M respectively.

