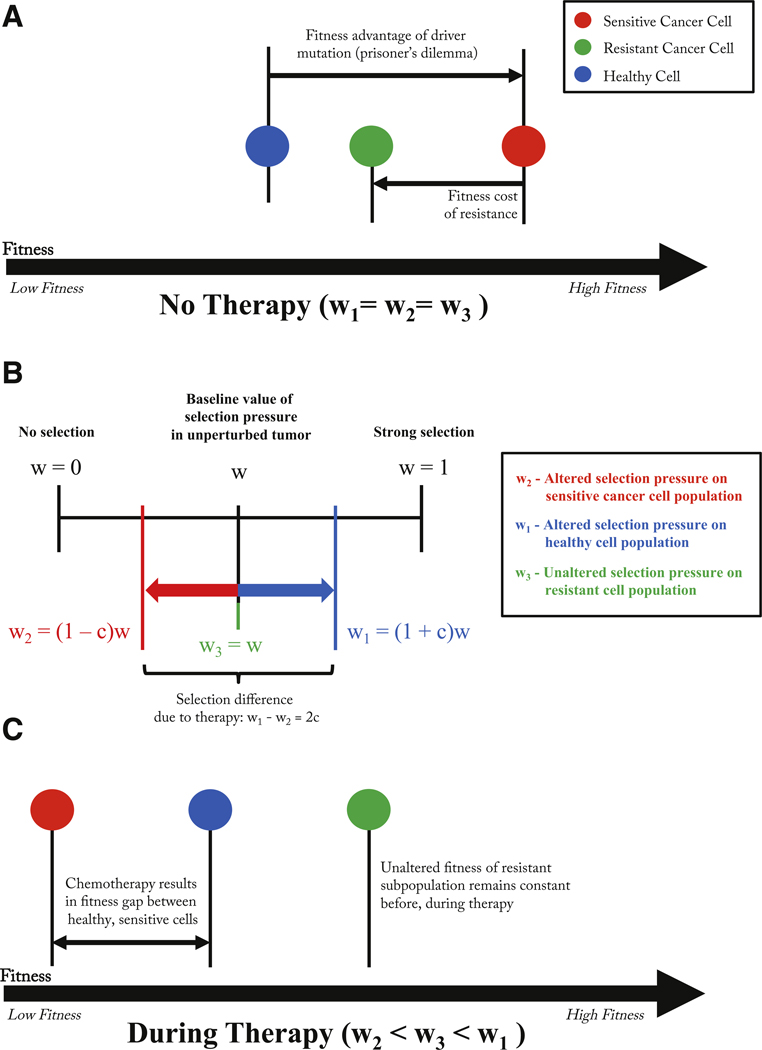
Fig. 4. Fitness landscape before and during therapy.
– (A) Before therapy, a driver mutation leads to a fitness advantage of the cancer cell (red) and a subsequent resistant-conferring mutation comes at a fitness cost (green). Parameters determined by the prisoner’s dilemma payoff matrix reflect these relative fitness differences. (B) Rather than change the elements of the game payoff matrix directly, the selection parameter is manipulated for healthy (increased) and cancer (decreased) subpopulations such that w1 − w2 = 2c. (C) Changes in wi results in a new relative fitness of each subpopulation during therapy. The fitness of the resistant population is unaffected by therapy’s selective pressure, but the healthy population is given an advantage over the chemo-sensitive population.

