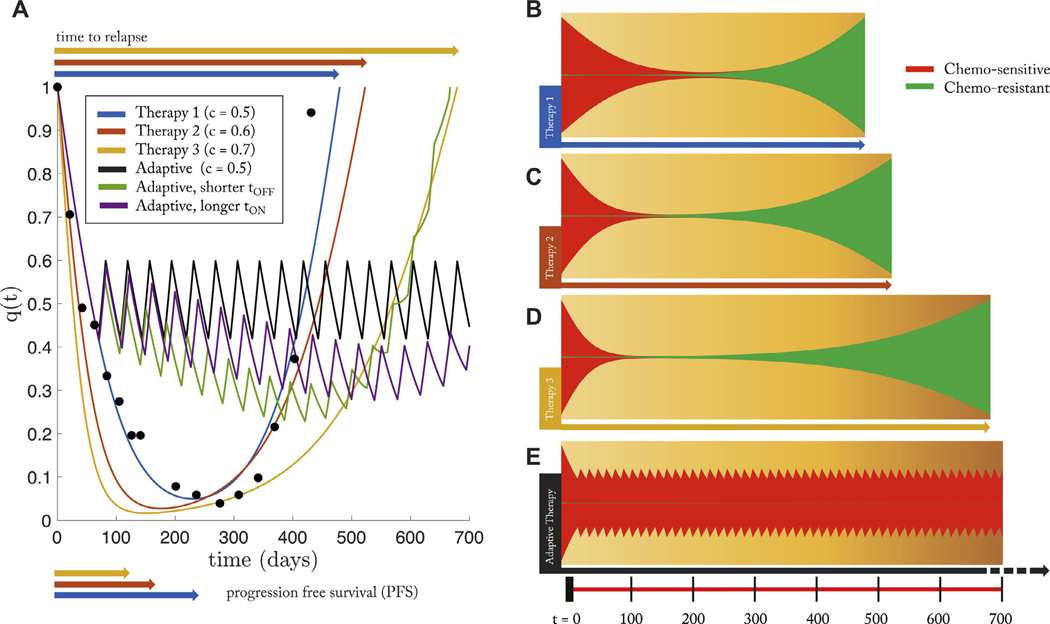
Fig. 6. The effect of dose on tumor relapse and progression free survival under continuous and adaptive therapy.
– (A) PSA data is from a single patient (see Fig. 3B) under continuous treatment (Mitoxantrone and Prednisone) is replotted (black dots) along with the best model fit (Eq. (2), (3)) in blue. Using identical patient parameters, continuous treatment of two “new”drugs with higher effectiveness (i.e. increased effective dose, c) is shown in red and yellow. Time to relapse significantly increases with increasing dose while the progression free survival shows marginal, but decreasing, difference. An adaptive therapy (see Fig. 5B) is also simulated (solid black line), showing an increased control over the tumor; Similar control paradigms were simulated with error in administration times: slightly shorter time on therapy (1 day; green) and slightly longer (1 day; purple). (B) The same four therapies are shown in a fish plot. Continous therapies show relapse to initial tumor size is dominated by chemo-resistant population (green). The adaptive therapy successfully suppressed the growth of the resistant population (bottom). Parameters used: α − β = 0.02; w = 0.10; f = 0.2.

