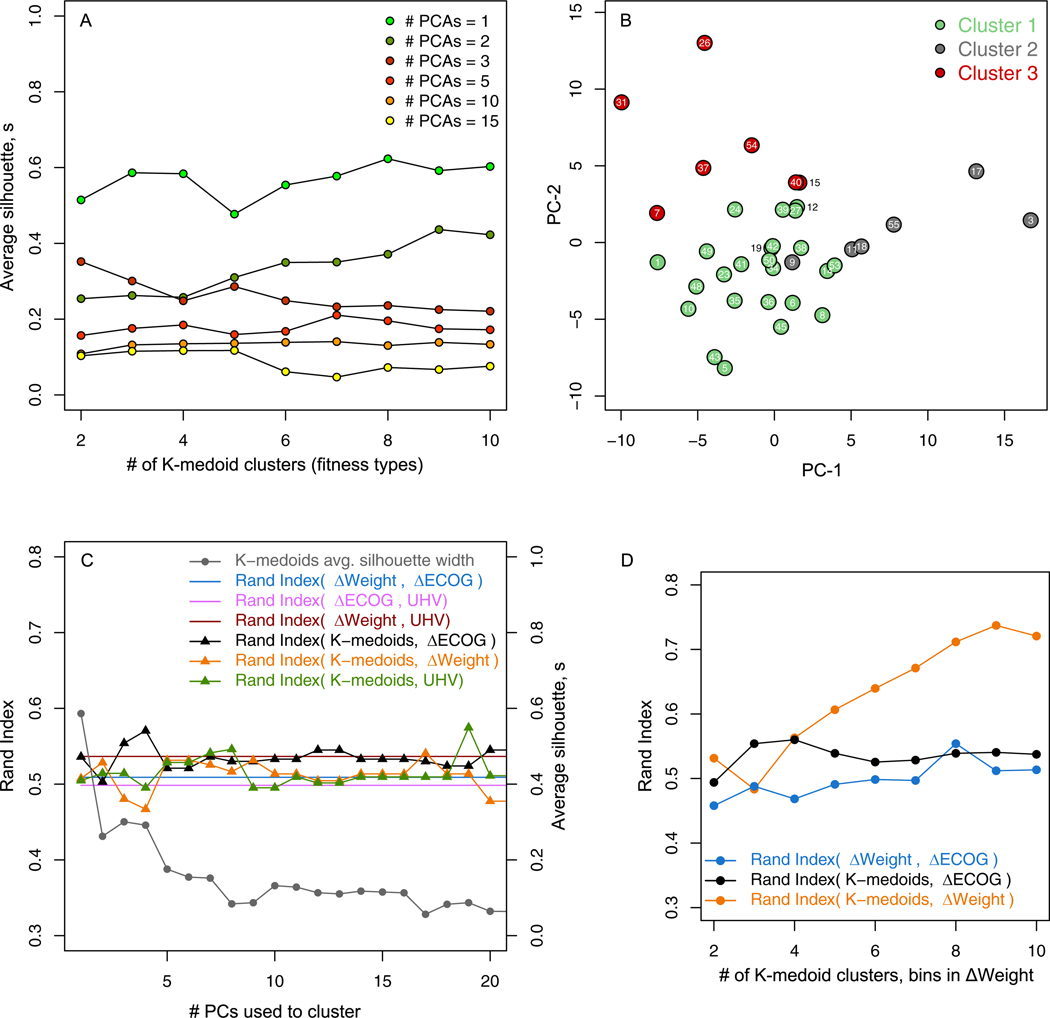
Fig. 6.
A) Quality of K-medoids patient clusterings measured by average silhouette s compared to the number of clusters k for different numbers of principal components N in the reduced distance matrix Dr. B) N = 3 and k = 3 K-medoids unsupervised clustering of patients shown in the plane formed by the first two principal components of Dr. C) The RI concordance between the k =3 K-medoids clusterings and physician ΔECOG (black), ΔWeight (yellow), and UHV (green) compared to benchmark RI associations among the ΔECOG, ΔWeight, and UHV based clusterings (solid lines). Quality of the K-medoids clusterings (gray) is shown on the right axis. D) Concordance between clusterings where the number of clusters in K-medoids and bins in ΔWeight are increased.

