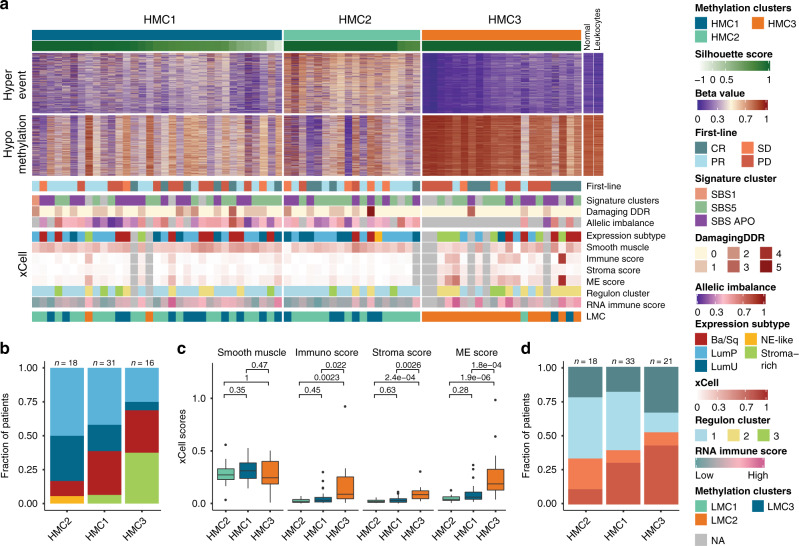
Fig. 5. DNA methylation subtypes based on hypermethylated cancer-specific CpG sites.
a Clustering of samples based on hypermethylation events (n = 5000). Heatmap shows beta values and the right panel shows normal bladder and leukocyte beta values for comparison. b Methylation clusters compared to gene expression subtypes. c Gene set scores calculated using xCell and stratified by methylation clusters (HMC2: n = 17; HMC1: n = 31; HMC3: n = 16). d RECIST 1.1 response measurements stratified by methylation clusters. MEscore = Microenvironment score. P-values were calculated using a Wilcoxon rank-sum test. For all boxplots, the center line represents the median, box hinges represent first and third quartiles, whiskers represent ±1.5 × interquartile range (IQR) and points represent outliers. Source data are provided as a Source data file.

