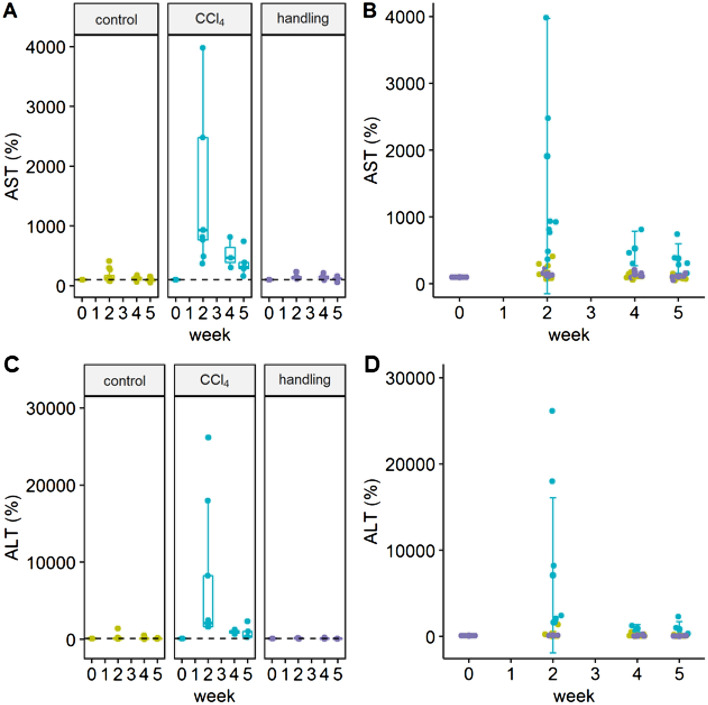
Figure 1.
Serum levels of AST and ALT in %. (A) Serum values of AST are depicted as box plots with an indication of the median value. Whiskers are determined using the Tukey method (1.5 × IQR). (B) Individual AST values in the three experimental groups are given. Type III ANOVA F(2; 85) = 7.6130; week 2: CCl4 vs control; ***p < 0.001, padj < 0.0001; week 2: CCl4 vs handling; ***p < 0.001 padj < 0.0001. (C) Serum values of ALT with indication of the median value (D) Individual ALT values of all experimental groups. Type III ANOVA F(2;20.54) = 3.6966; week 2: CCl4 vs. Control; ***p < 0.001; padj < 0.0001; week 2: CCl4 vs handling; ***p < 0.001 padj < 0.0001. The graphs were generated using the R software version (3.6.2) (R Core Team (2017). R: A language and environment for statistical computing. R Foundation for Statistical Computing, Vienna, Austria. https://www.R-project.org/).

