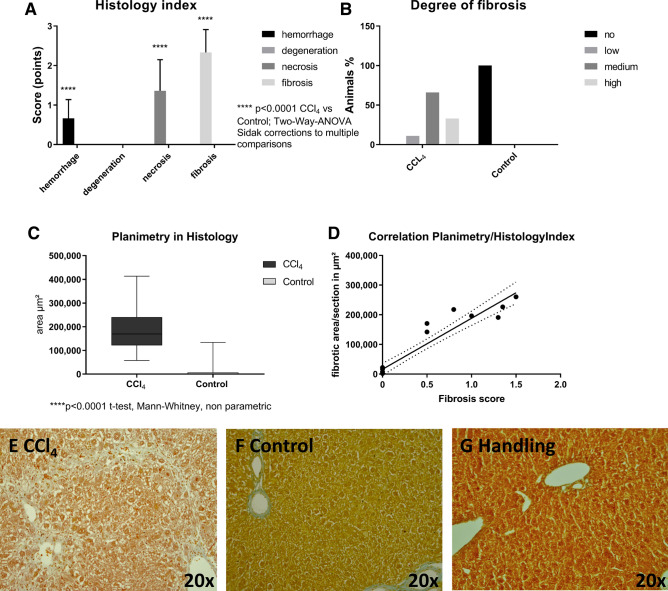
Figure 2.
Histological analysis of liver tissue after 4 weeks of treatment (CCl4, control) and microscopic images of liver sections (CCl4, control, handling) in Masson Goldner staining (× 20). Collagen deposits are indicated as pale blue colored tissue (A) Histology index. Two-way ANOVA F(3, 304) = 142.6 ****p < 0.001(Sidak corrections for multiple comparisons) padj = < 0.0001. (B) Degree of fibrosis. (C) Planimetric analysis. ****p < 0.0001 t-test, Mann–Whitney, non-parametric. (D) Correlation of planimetry and histology index. r = 0.95; r2 = 0.91; 95% confidence interval 0.8729 to 0.9834. (E) Representative image of a liver section showing moderate fibrosis in the CCl4 group (F) a section obtained from a control animal and (G) histological appearance of liver section obtained from a handling group animal. The graphs were generated using GraphPad Prism version 7.00 for Windows (GraphPad Software, La Jolla California USA, www.graphpad.com).

