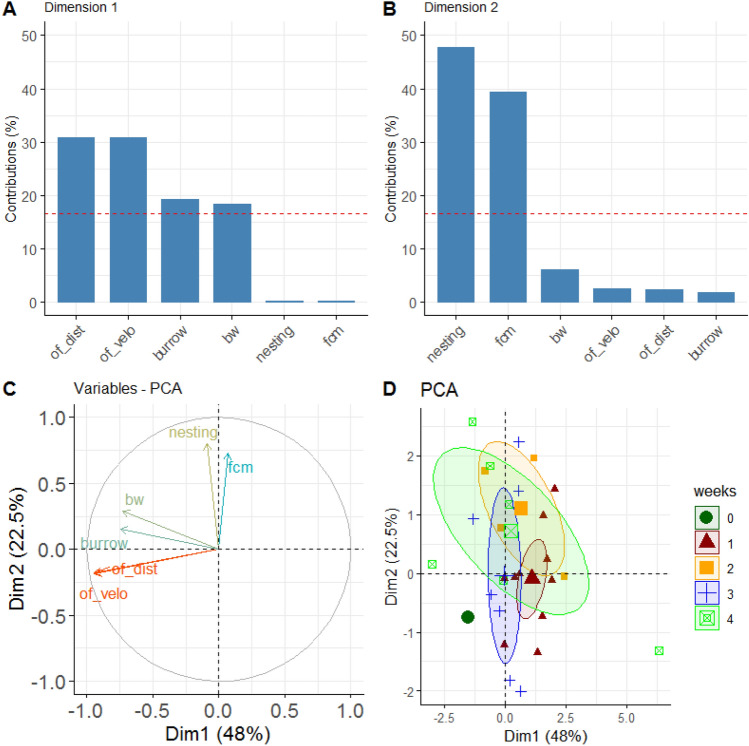
Figure 6.
Principal Component Analysis of the CCl4 group. (A) Variance contributions of factors in % in the first dimension. (B) Contribution of factors in % in the second dimension. (C) Variable correlation plot showing the relationships of all variables in the experiment. Positively correlated variables are grouped, negative ones show in different directions. The vector lengths represent the quality in the factor space. The longer they are the better the variables are represented in the shown dimensions. (D) Projection of individual animals into the two-dimensional PCA factor space. Group centroids are characterized by the 95% confidence ellipses and the experimental times are color-coded as weeks. The graphs were created using the R software version (3.6.2) (R Core Team (2017). R: A language and environment for statistical computing. R Foundation for Statistical Computing, Vienna, Austria. https://www.R-project.org/).

