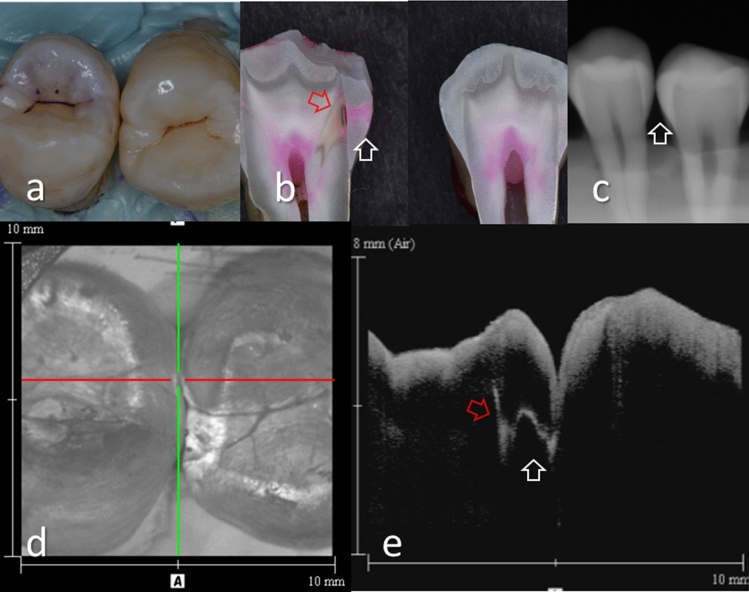
Figure 4.
Images of teeth with intact proximal surface (score 0) and hidden dentin caries (score 3). (a) Occlusal view of proximal contacts. (b) Histological view of the area of interest stained with 5% acid red solution. Left: Enamel demineralization penetrating the entire enamel thickness. However, breakdown of enamel surface was not evident (white allow). Dentin caries with slight cavitation was observed penetrating along DEJ (red arrow, score 3). Right: Intact (score 0). (c) Intraoral digital radiograph. Evidence of caries was not clear (white arrow). (d) En face intensity image generated by 3D OCT. (e) Extracted 2D image of the area along the red line in d. Left: Brightness of proximal zone was significantly increased penetrating the entire enamel thickness (white arrow). The brightness of the DEJ was increased because of lateral spread of the lesion along DEJ (red arrow). Because of the slight cavitation along DEJ, intensity of brightness at DEJ appears higher than Fig. 3e left. Right: Brightness of proximal surface was not increased and almost constant. The dynamic slicing 3D video is presented in Supplementary Materials: Video 3.

