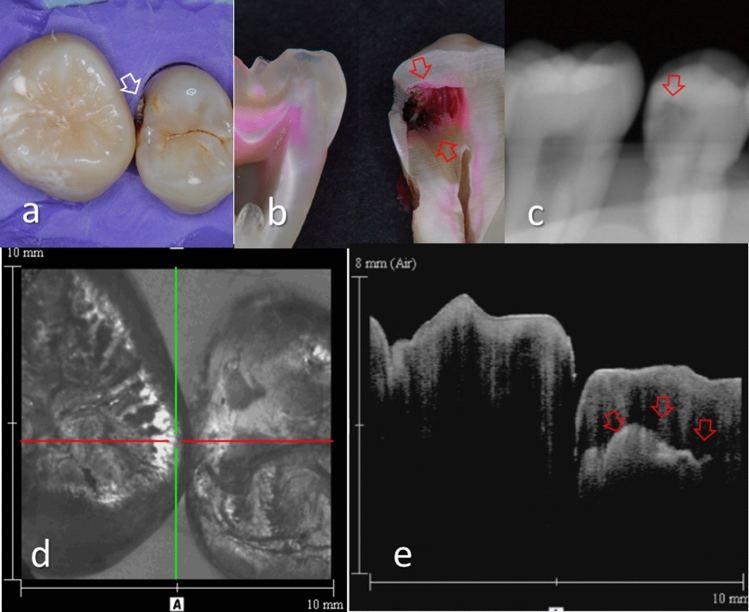
Figure 7.
Images of teeth with intact proximal surface (score 0) and advanced dentin caries (score 3). (a) Occlusal view of proximal contacts. Presence of cavitation was visually accessible in this case (white arrow). (b) Histological view of the area of interest stained with 5% acid red solution. Left: intact (score 0). Right: Advanced dentin caries with distinct cavitation (red arrows, score 3). (c) Intraoral digital radiograph. Dentin caries was imaged as a translucent zone penetrating close to the pulp (red arrow). (d) En face intensity image generated by 3D OCT. (e) Extracted 2D image of the area along the red line in d. Left: The contour line of the proximal surface was smooth without any cavitation. The brightness of the proximal zone was almost constant with no evidence of enamel demineralization. Right: There was a distinct bright line penetrating beyond the DEJ (red arrows). The upper border of the hollow space due to caries showed strong light scattering. The dynamic slicing 3D video is presented in Supplementary Materials: Video 6.

