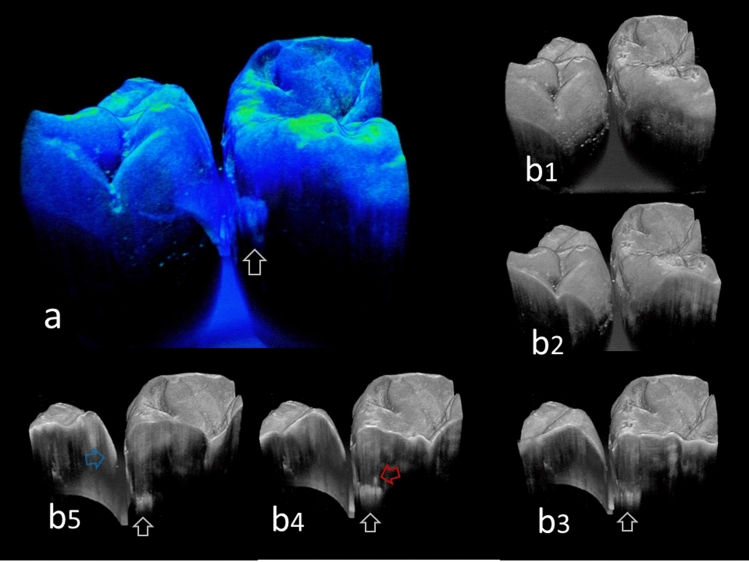
Figure 8.
3D SS-OCT images of the same teeth in Fig. 5. (a) Pseudocolor image processed translucently. Presence of caries at the proximal surface was clearly imaged with the lesion location and size (white arrow). (b1–5) Sequential 2D images acquired in 3D view from different thickness. White arrows: enamel demineralizarion penetrating entire enamel thickness. Red arrow: lateral spread of caries along DEJ. Blue arrow: incipient enamel demineralization.

