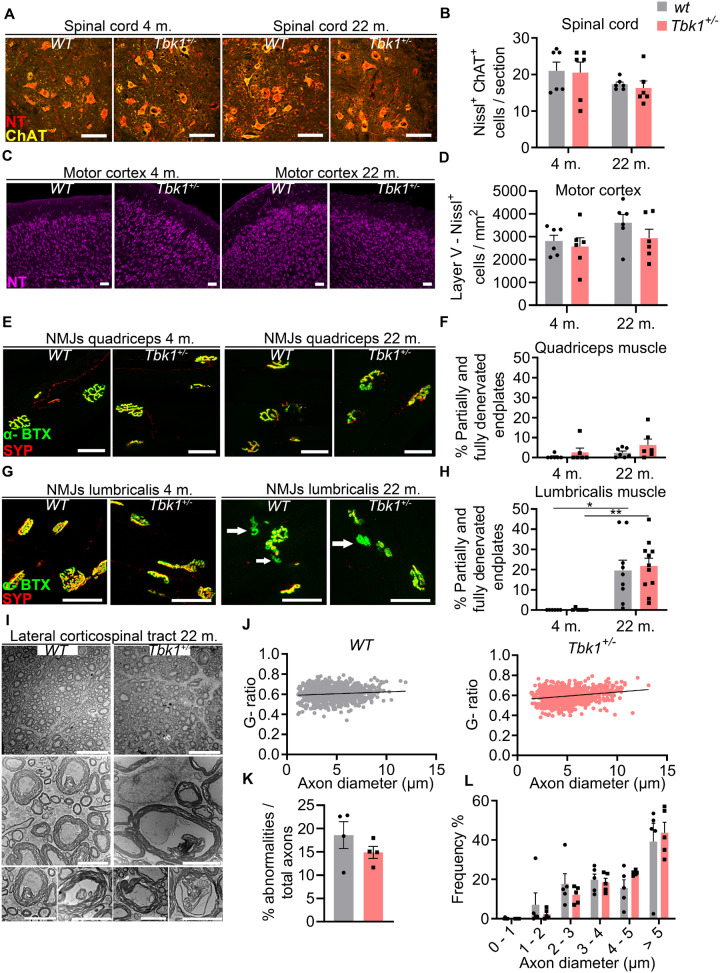
Figure 2.
Hemizygous deletion of Tbk1 does not affect MN viability and muscular innervation. (A) Representative pictures of LSC anterior horn sections of both genotypes at 4 and 22 months stained for NT and choline acetyltransferase. Scale bar = 100 µm. (B) Quantification of LSC MNs shows similar numbers in Tbk1+/− and wt mice at either age. N = 6 mice. (C) Representative pictures of motor cortex sections of 4- and 22-month old Tbk1+/− and wt mice stained with NT. Scale bar = 50 µm. (D) Quantification of NT-positive neurons per mm2 in the V layer of the motor cortex shows similar numbers in Tbk1+/− when compared to aged matched wt mice. N = 6 mice. (E) Representative pictures of NMJs of the m. vastus medialis and m. quadriceps of 4- and 22-month old Tbk1+/− and wt mice stained for α-Bungarotoxin and synaptophysin. Scale bar = 50 µm. (F) Quantification of partially and fully denervated NMJs of the m. vastus medialis/m. quadriceps. N = 6–7 mice. (G) Representative pictures of NMJ of the m. lumbricalis of both genotypes at 4 and 22 months stained for α-Bungarotoxin and synaptophysin). White arrows indicate denervated NMJs. Scale bar = 50 µm. (H) Quantification of fully and partially denervated NMJs of the m. lumbricalis shows a genotype-independent age-related muscular denervation. N = 6–11 mice. (I) Representative pictures of transmission electron microscopy of the corticospinal tract in the LSC of 22-month old Tbk1+/− and wt mice. Scale bar = 20 µm. Lower higher magnification images show from left to right, examples of axons with myelin shield containing inner protrusion, detached axon, myelin out folding and an axon with degenerated myelin. Scale bar = 5 µm. (J) Graphs showing the correlation between the diameter and the g-ratio (axon diameter/total diameter of the axon plus the myelin sheath) per axon. N = 5 mice. (K) Quantification of different axon abnormalities. N = 4 mice. (L) Analysis of the axon diameters distribution shows no differences between 22-month old Tbk1+/− and wt mice. N = 5 mice. Data in B, D, F and H have been analysed by two-way ANOVA followed by Tukey’s multiple comparisons correction. **P < 0.01; *P < 0.05. Data in K and L have been analysed by t-test. All bar graphs are shown as mean ± SEM.

