Figure 3.
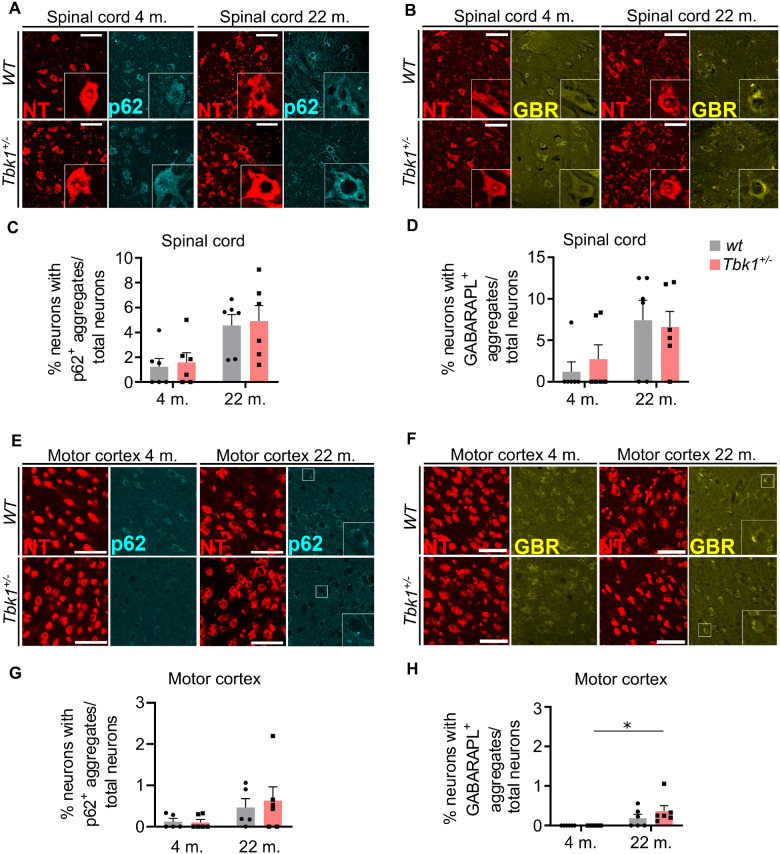
Autophagy in spinal cord and motor cortex is not influenced by hemizygous loss of Tbk1. (A) Representative pictures of LSC sections stained for NT and the autophagy marker p62. Scale bar = 100 µm. (B) Representative pictures of LSC sections stained for NT and the autophagy marker GABARAPL1. Scale bar = 100 µm. (C) and (D) Bar graphs showing the percentage of neurons containing p62 and GABARAPL1 positive inclusions in spinal cord of 4- and 22-month old mice from both genotypes. In both graphs a trend can be seen towards the aged cohorts. (E) and (F) Representative pictures of brain motor cortex sections stained for NT and p62 and NT and GABARAPL1. respectively. Scale bar = 50 µm. (G) and (H) Bar graphs showing the percentage of neurons containing p62 and GABARAPL1 positive inclusions in brain cortex of 4- and 22-month old mice from both genotypes. A genotype-independent age-related accumulation of GABARAPL1 inclusions is observed in the cortex of the transgene mice. All bar graphs are shown as mean ± SEM. All data analysed by two-way ANOVA followed by Tukey’s multiple comparisons. *P < 0.05. N = 5–6.

