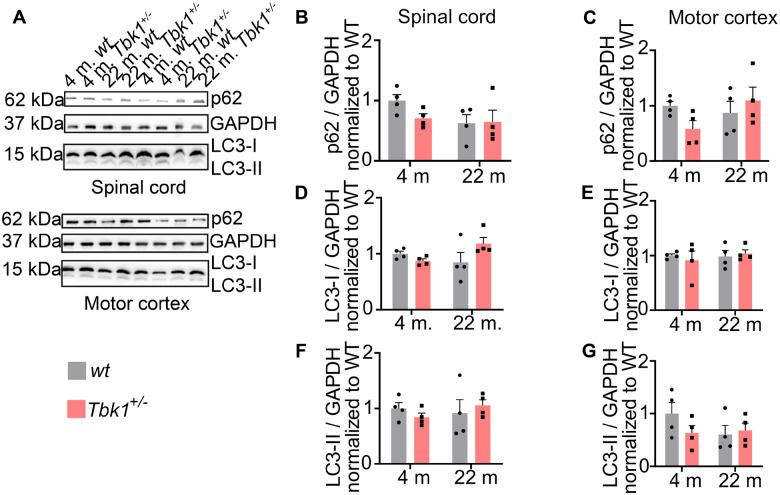
Figure 4.
Autophagic markers stay unchanged upon ageing and Tbk1 reduction in vivo. (A) Representative western blot picture of spinal cord and brain cortex lysates. Protein expression levels of LC3-I/-II and p62 have been analysed; 30 µg of protein have been loaded per lane. GAPDH has been used as loading control. (B), (D) and (F) bar graphs showing the quantifications of p62 and LC3-I/-II protein expression in mice spinal cord lysate while (C), (E) and (G) show quantifications of the same protein expression in brain cortex lysates. All bar graphs are shown as mean ± SEM. All data analysed by two-way ANOVA followed by Tukey’s multiple comparisons. N = 4.

