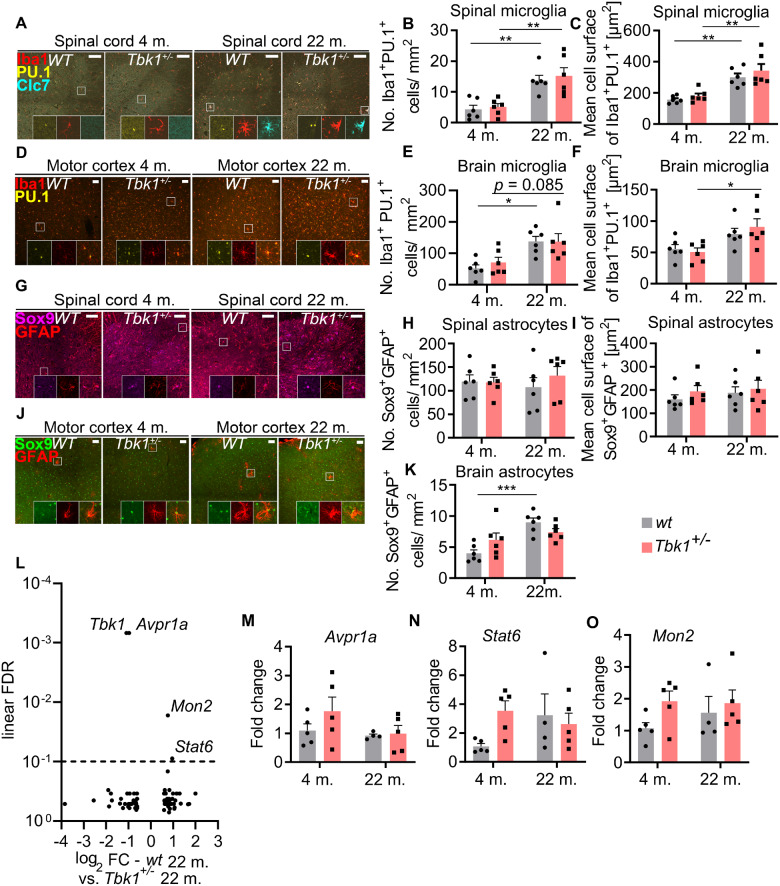
Figure 5.
Tbk1 heterozygous loss does not influence age-related microglia activation in mice spinal cord and motor cortex. (A) Representative pictures of LSC sections stained for the microglia markers Iba1, Clec7a (Clc7) and PU.1. Enlargements show that only microglia of 22-month old mice are Clec7a-positive. Scale bar = 100 µm. (B) Quantification of Iba1+/PU.1+ cells in the grey matter of the LSC shows a genotype-independent increase in microglia numbers in 22-month old mice. (C) The mean cell size of Iba1+/PU.1+ microglial cells in the LSC differs between young and old but not between Tbk1+/− and wt mice. (D) Representative pictures of motor cortex sections stained for PU.1 and Iba1. Scale bar = 50 µm. (E) Age-dependent but genotype-independent increase in the numbers of Iba1+/PU.1+ microglia in the motor cortex. (F) The mean cell size of Iba1+/PU.1+ microglial cells in the motor cortex differs significantly only between young and old Tbk1+/− mice. (G) LSC sections stained for the astrocytic markers GFAP and Sox9. Enlargements show GFAP+/Sox9+ astrocytes. Scale bar = 100 µm. (H) Quantification of GFAP+/Sox9+ astrocytes in the LSC reveals similar numbers, independently of genotype and age. (I) The mean cell size of GFAP+/Sox9+ astrocytes in the LSC does not differ between Tbk1+/− and wt and young and old mice. (J) Representative pictures of motor cortex sections stained for GFAP and Sox9. Scale bar = 50 µm. (K) Quantification of GFAP+/Sox9+ astrocytes in motor cortex shows higher numbers only in aged wt mice compared to young ones. N = 6 for all analyses. (L) Volcano plot of RNA sequencing analysis of laser micro-dissected LSC MNs from wt and Tbk1+/− mice at the age of 22 months. Horizontal line indicates threshold for FDR (0.1). After FDR correction for multiple testing only four genes remain significantly altered (including Tbk1). (M)–(O) qPCR results of mRNA analysis from whole LSC lysates for validation of Avpr1a, Stat6 and Mon2 levels. N = 5. All bar graphs are shown as mean ± SEM. All data have been analysed by two-way ANOVA followed by Tukey’s multiple comparisons. *P < 0.05; **P < 0.01;***P < 0.001.

