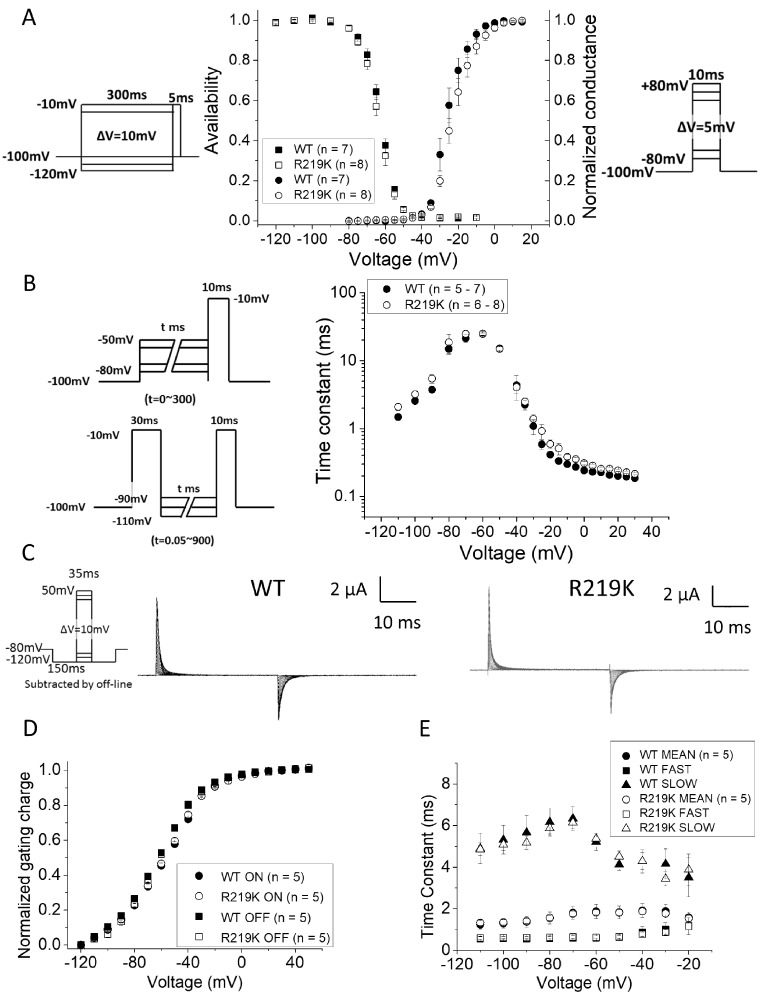
Figure 2.
The functional analysis of NaV1.4-R219K gating. (A) The voltage dependent conductance (G–V relationship) and the voltage dependent steady-state fast inactivation (V-hinf) in wild type NaV1.4 (n = 7) and NaV1.4-R219K (n = 8) are shown. The pulse protocols used are shown as insets, in the right for G-V and in the left for V-hinf. (B) Voltage dependent time constants for fast inactivation (Tau–V relationship) in wild type NaV1.4 (n = 5–7) and NaV1.4-R219K (n = 6–8) are shown. The left upper panel indicates the two-pulse protocol for the entry to fast inactivation from −80 mV to −50 mV, and the left lower for the recovery from fast inactivation from −110 mV to −90 mV, respectively. Error bars indicate standard error of the mean. (C) Representative charge-displacement currents from the wild type of NaV1.4 (WT) and NaV1.4 with R219K mutation (NaV1.4-R219K). The pulse protocol used is shown as inset in the left. (D, E) The relative charge moved by the voltage sensors (integral of charge-displacement current) is shown as a function of test potential in the Q–V relationship (D) and Tau–V relationship (E) for WT (n = 5) and NaV1.4-R219K (n = 5), respectively. The time constant of gating currents were fitted by two-exponential fitting and plotted both fast components and slow ones separately (opened triangles and squares). The mean of time constant was calculated by the weighted average and are shown in filled marks.

