FIGURE 4.

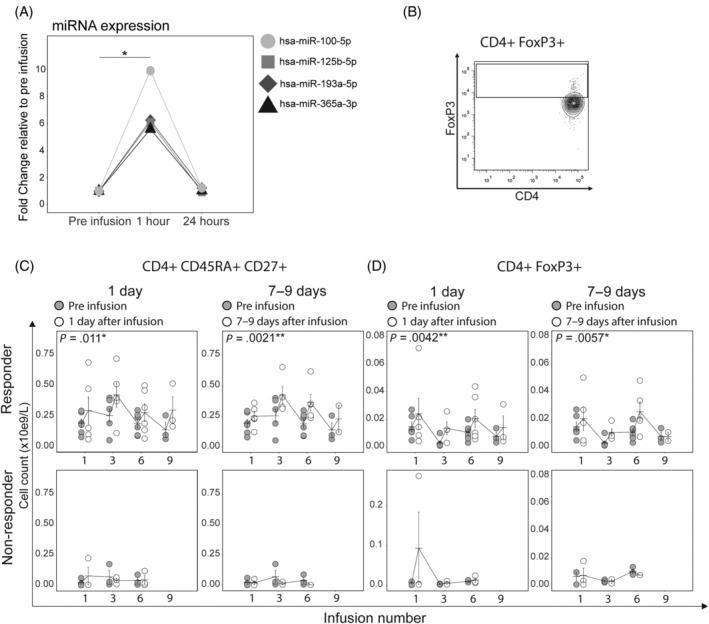
Short‐term increases in naïve miRNA, T cells, and Tregs after infusion. A, Four circulating miRNAs were significantly up regulated in R and NR plasma at 1 hour after mesenchymal stromal cell (MSC) infusion 1 and returned to baseline levels 24 hours after infusion. t Test with Benjamini‐Hochberg correction. B, Representative plots of the flow cytometry analysis. Tregs are defined as CD4+ FoxP3+ T cells. Naïve CD4+ T cells are defined as in Figure 2 (CD4+ CD45RA+ CD27+). C and D, Absolute number of naïve CD4+ T cells and Tregs increase in R 1 and 7 days after each MSC infusion compared with before infusion. These short‐term increases are not seen in NR. X‐axes display infusion number. The P‐values are derived from the mixed effects model and represent the significance of the factor Days since last infusion. *P < .05, **P < .005. Error bars show mean ± SEM. R, responder; NR, nonresponder; Treg, regulatory T cell
