
FIGURE 2.
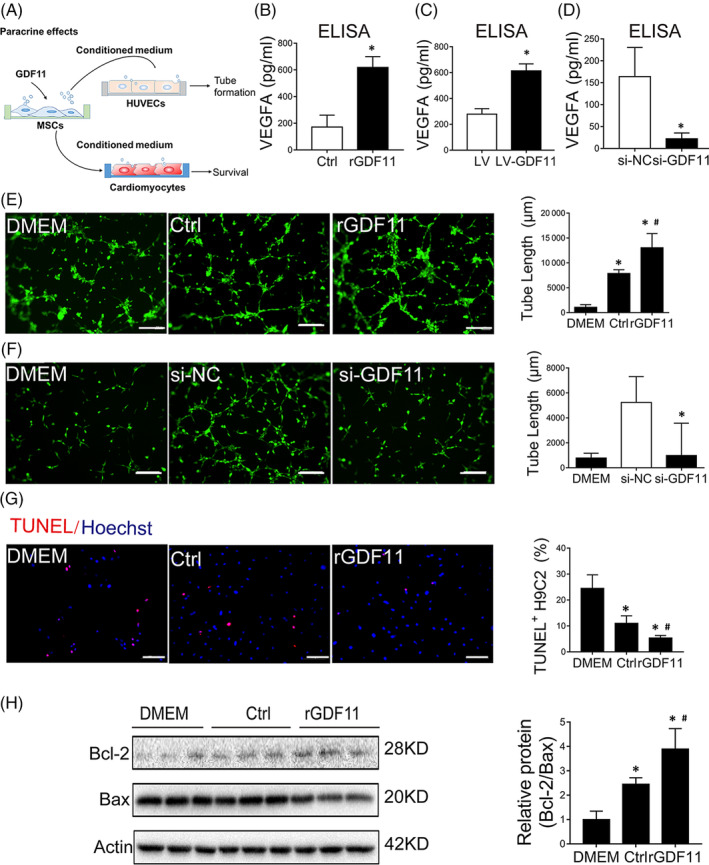
GDF11 enhanced paracrine effects of MSCs in vitro. A, Schematic working showed the experiments for evaluating the paracrine effect of MSCs with different treatment. B‐D, The VEGFA levels in conditioned medium from MSCs (Ctrl, rGDF11) (B) or (LV, LV‐GDF11) (C) and (si‐NC, si‐GDF11) (D) were determined by ELISA assay. E, Representative images of tube formation assay of HUVECs/GFP under fluorescent microscopy. HUVECs were cultured with DMEM or conditioned medium of MSCs that had been cultured in the absence (Control) or presence of rGDF11. Scale bar = 100 μm. Quantification of tube formation was shown in bar graphs (n = 8). F, Representative images of tube formation assay of HUVECs/GFP that were cultured with DMEM or conditioned medium of MSCs that had been transfected with siRNAs (si‐GDF11, and NC as negative control). Quantification of tube formation was shown in bar graphs (n = 13). Scale bar = 100 μm. G, TUNEL assay of apoptosis of H9C2 cells that were cultured with DMEM medium or conditioned medium of MSCs that had been cultured in the absence (Control) or presence of rGDF11 (n = 8). Scale bar =50 μm. H, Western blot analysis of apoptosis‐related proteins in H9C2 cells cultured as in G. β‐actin was used as internal control. The quantification was shown in bar graphs (n = 3). The conditioned medium had been normalized by an equivalent number of MSCs (1 × 10⁶ cells). Data are shown as mean ± SD. *P < .05 vs DMEM/Ctrl/si‐NC, # P < .05 vs Ctrl