
FIGURE 3.
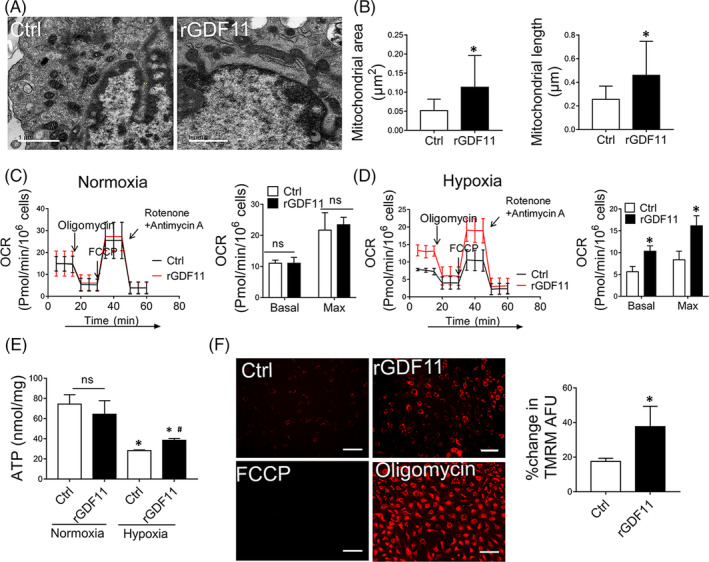
GDF11 protected mitochondrial morphology and function under hypoxic condition. A, Representative images of MSCs under hypoxia condition were taken by electron microscopy (×10 000). Scale bar =1 μm. B, Mitochondrial morphology was analyzed by quantification of area and longitudinal length of mitochondria in MSCsCtrl and MSCsrGDF11 (n = 77 for MSCsCtrl, and n = 95 for MSCsrGDF11). C, D, Mitochondrial respiration reflected by OCR was detected in MSCs alone, MSCs treated with rGDF11 under normoxic (C) or hypoxic (D) conditions. OCRs were assayed under both basal and maximal conditions (n = 3). E. Cellular ATP levels of MSCsCtrl and MSCsrGDF11 under normoxic or hypoxic conditions were measured through luciferin/luciferase‐based assay, and the data were calibrated with protein content. F, Images of MSCs stained with TMRM under fluorescence microscope were used to measure mitochondrial membrane potential. MSCs were treated with rGDF11 (50 ng/mL) for 24 hours then exposed to hypoxia conditions for 48 hours. MSCs treated with either FCCP (50 μmol/L) or oligomycin (10 μmol/L) were served as negative and positive controls, respectively. Scale bar = 100 μm. Bar graph shows relative mean of fluorescence intensity (MFI) of Control or rGDF11 divided by the difference of MFI between Oligomycin and FCCP (n = 8). Data were shown as mean ± SD. *P < .05 vs Ctrl, # P < .05 vs Hypoxia Ctrl