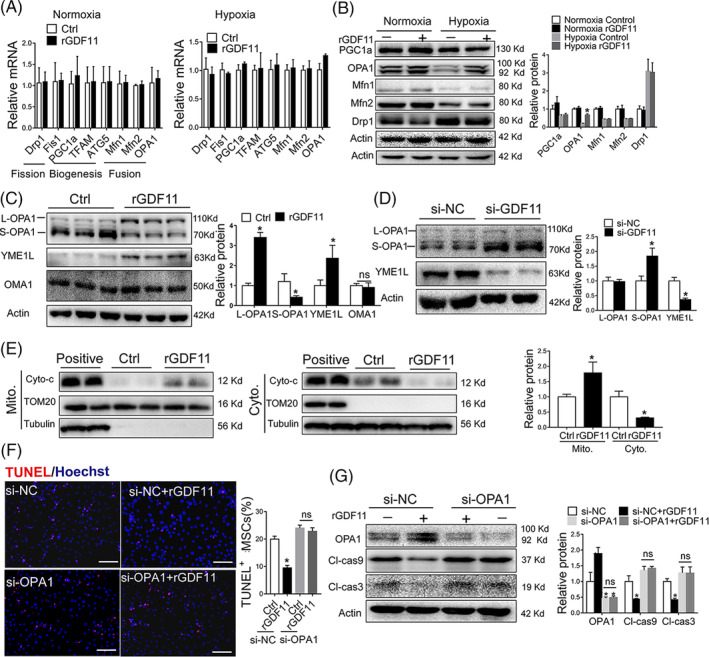
FIGURE 4.

OPA1 was indispensable for the protective effects of GDF11 in response to hypoxic condition. A, Quantitative analysis of mRNAs of genes involved in mitochondrial homeostasis for MSCsCtrl and MSCsrGDF11 under normoxic or hypoxic condition. Relative mRNA levels were all compared with 18 seconds RNA. B, Western blot analysis of mitochondrial proteins: PGC‐1α, OPA1, Mfn1/2 and DRP1. Monoclonal antibody for OPA1 was used. Quantification of the proteins relative to control β‐actin was shown in right (n = 3). C, Western blot analysis of OPA1, YME1L and OMA1 in MSCsCtrl and MSCsrGDF11 under hypoxic condition. OPA1 detected by a polyclonal antibody. Quantification of the proteins relative to control β‐actin was shown in the bar graph (n = 3). D, Western blot analysis of OPA1 and YME1L in MSCssi‐NC and MSCssi‐GDF11 in the same way as in C (n = 4). E, Western blot analysis of Cyto‐C in cytoplasm and mitochondrial. The values of Cyto‐C in mitochondrial were normalized with TOM20. And the values of Cyto‐C in cytoplasm were normalized with tubulin. Quantification was shown in the bar graph (n = 4). F, TUNEL staining of MSCs that were transfected with siRNAs (si‐NC and si‐OPA1), followed by treatment with rGDF11 for 24 hours and then exposed to hypoxia condition for 48 hours. Scale bar = 50 μm. Apoptotic cells were quantified by counting TUNEL‐positive nuclei out of total cells (n = 9). G, Western blot analysis of OPA1, cleaved caspase 3 and 9. Quantification of the proteins relative to control β‐actin was shown in the bar graph (n = 3). Data were shown as mean ± SD. *P < .05 vs si‐NC/Ctrl
