FIGURE 5.

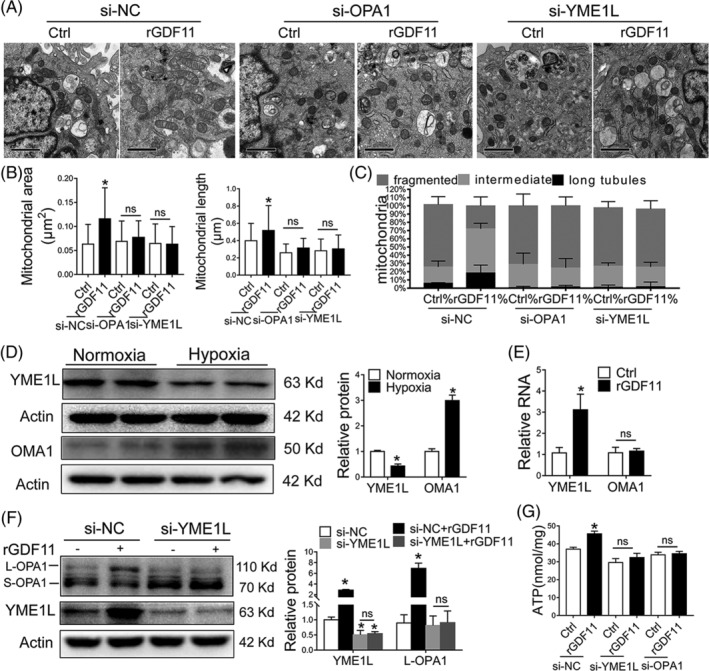
GDF11‐mediated OPA1 processing depends on YME1L. A, Representative TEM images of MSCs transfected with siRNA‐OPA1 or siRNA‐YME1L for 48 hours and then incubated with rGDF11 (50 ng/mL) for 24 hours and then exposed to hypoxia conditions for 48 hours (×10 000). Scale bars: 1 μm. B, C, Quantification of mitochondrial area, longitudinal length and size distribution according to their length: long tubules (>0.65 μm), intermediate (≤0.65 μm, ≥0.32 μm), and fragmented (<0.32 μm) (n = 105 for MSCsi‐NC, n = 64 for MSCssi‐NC + rGDF11, n = 123 for MSCsi‐OPA1, n = 68 for MSCsi‐OPA1 + rGDF11, n = 93 for MSCsi‐YME1L, and n = 96 for MSCsi‐YME1L + rGDF11). D, Representative immunoblots and densitometric quantification for the expression of YME1L and OMA1 under normoxic and hypoxic conditions (n = 4). E, mRNA levels of YME1L and OMA1 in MSCsCtrl and MSCsrGDF11, and 18 seconds served as control. F, Western blot analysis of YME1L and OPA1. YME1L and L‐OPA1 were quantified and presented as relative level by comparing with β‐actin control (n = 3). G, Intracellular ATP levels in MSCs at specified conditions were determined. ATP levels was calibrated with protein content (n = 3). Data were shown as mean ± SD. *P < .05 vs si‐NC
