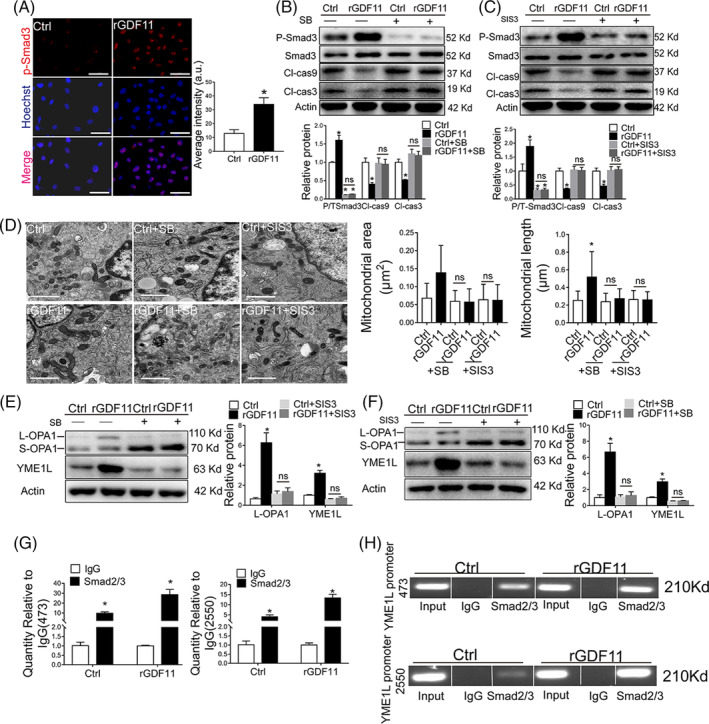
FIGURE 6.

GDF11 protected MSCs from hypoxia‐induced apoptosis through ALK5‐Smad2/3 pathway. A, Localization of p‐Smad3 in MSCs. DAPI were stained with for nuclear (blue) and fluorescence‐labeled Ab against phosphorylated Smad3 (red). Scale bar = 50 μm. Fluorescence intensity was quantified. B, C, Western blot analysis of p‐Smad3, cleaved caspase 3 and 9 in MSCs which were treated with TGFβR1 inhibitor SB4431542 (B) or p‐Smad3 inhibitor SIS3 (C) for 30 minutes, and incubated with rGDF11 (50 ng/mL) for 24 hours and then exposed to hypoxia condition for 48 hours (n = 3 in B and C). D, Representative TEM images of MSCs treated as described in (B, C) (×10 000). Scale bar =1 μm. Mitochondria were visually scored for their area and longitudinal length. n = 149 for MSCCtrl, n = 63 for MSCsrGDF11, n = 153 for MSCCtrl + SB, n = 160 for MSCrGDF11 + SB, n = 151 for MSCCtrl + SIS and n = 139 for MSC rGDF11 + SIS. E, F, Immunoblot analysis of L‐OPA1 and YME1L in MSCs treated as specified. Relative proteins were presented by comparing each band density with that of β‐actin (n = 3 in E and F). G, H, The abilities of Smad2/3 binding to YME1L promoter sites at 473 to 485 and 2550 to 2562 were analyzed by ChIP assay. The purified DNA and input genomic DNA were analyzed by real‐time PCR (G). The PCR products were analyzed by gel electrophoresis (H). Each in vitro experiment was repeated three times. Data were shown as mean ± SD. *P < .05 vs IgG, # P < .05 vs Ctrl
