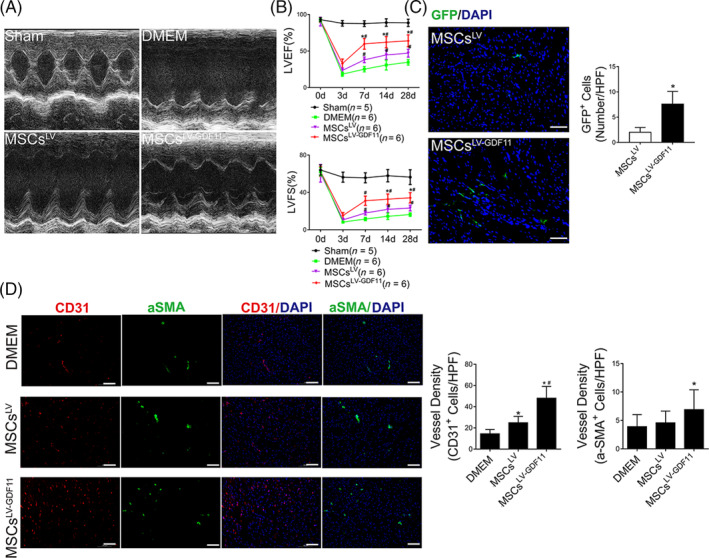
FIGURE 7.

Delivery of GDF11 overexpressing MSCs improved cardiac function after MI in vivo. A, Representative echocardiographic M‐mode images showed the changes of cardiac function in each group at 28 days after MI. B, Left ventricular ejection fraction and left ventricular fractional shortening were quantified at 3, 7, 14, and 28 days post MI (n = 5 for Sham group, n = 6 for DMEM group, n = 6 for MSCsLV group, and n = 6 for MSCsLV‐GDF11 group, respectively). C, MSCs retention at day 3 post‐MI (n = 6 for each group). Representative images of GFP staining were assayed by fluorescence microscopy, wherein GFP‐positive cells (in green) were specifically counted for MSCs retention, with nuclei stained with DAPI. Scale bar = 100 μm. D, Representative immunofluorescence image of CD31 staining for capillaries (red) and α‐SMA staining for arterioles (green) with nuclei stained with DAPI in the remote zone of ischemic heart from DMEM, MSCsLV, and MSCsLV‐GDF11 group mice at day 28 post‐MI. The capillary and arteriolar densities in the remote zones are quantified by 6‐8 HPFs per section in the bar graphs. Scale bar =100 μm. Data are shown as mean ± SD. *P < .05 vs DMEM/MSCsLV, # P < .05 vs MSCsLV
