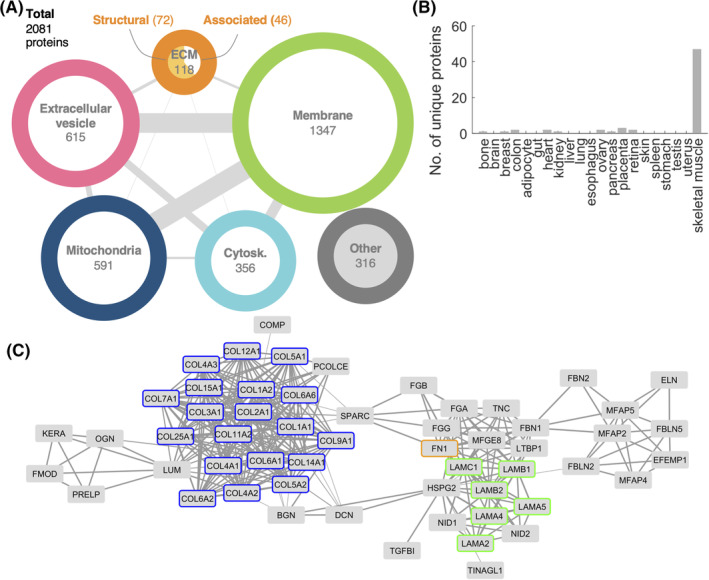
FIGURE 1.

Proteomic analysis of decellularized skeletal muscle. A, Classification of the 2081 identified proteins based on their localization. Edge thickness is proportional to the number of proteins in common between the two linked categories; circle radius is proportional to the number of proteins in that category. B, Number of proteins identified in our data that are annotated exclusively to the indicated tissue. Reference data of human proteins per tissue are described in Section 2. C, Protein‐protein interaction network, including only ECM structural proteins having at least one reported neighbor. Collagens, laminins, and fibronectin are highlighted in blue, green, and orange, respectively. Edge thickness is proportional to confidence of interaction. ECM, extracellular matrix
