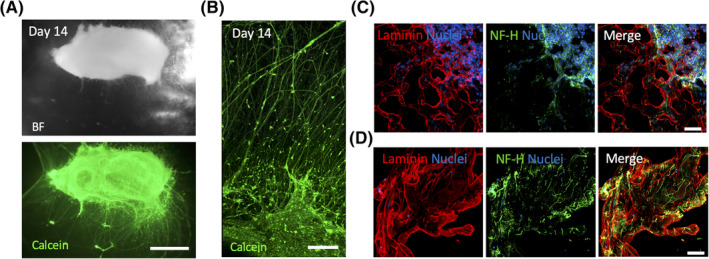
FIGURE 2.

3D culture of oSpC sections. A, Representative stereomicroscope live imaging of Calcein (green) incorporation from oSpC cultured into Matrigel at 14 days after seeding. Scale bar = 1 mm. BF, bright field. B, Two‐photon live imaging of oSpC‐derived neural projection incorporating Calcein (green) at 14 days after seeding into Matrigel. Scale bar = 200 μm. C, z‐stack images showing immunostaining for neurofilament‐H (NF‐H, green) and laminin (red) of cross‐sections performed in the middle region of the oSpC at 7 days after seeding into Matrigel. Nuclei were stained with Hoechst (blue). Scale bars = 50 μm. D, z‐stack images showing immunostaining for neurofilament‐H (NF‐H, green) and laminin (red) of cross‐sections performed in in the distal region of the oSpC at 7 days after seeding into Matrigel. Nuclei were stained with Hoechst (blue). Scale bars = 50 μm
