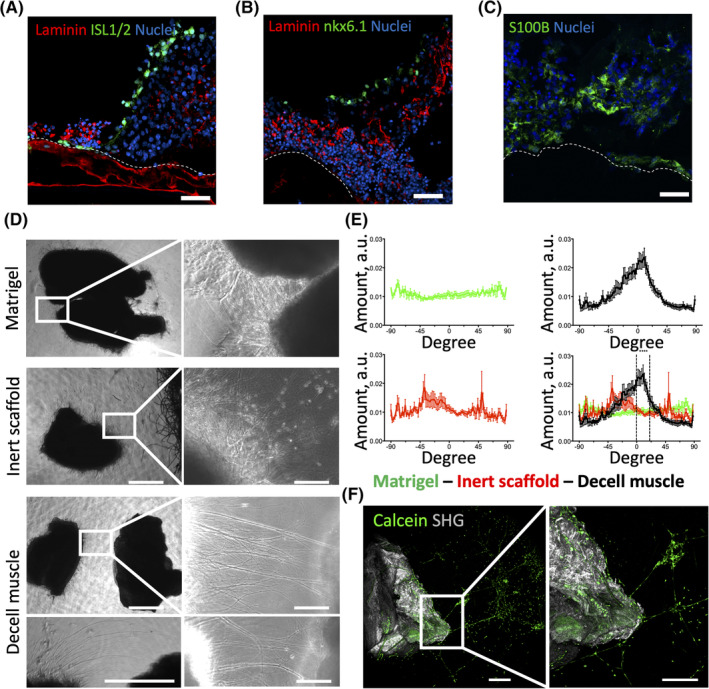
FIGURE 4.

Evaluation of multicellular composition and axonal attractant effect of decellularized muscles on oSpC culture. A‐C, z‐stack images showing immunostaining for ISL1/2 (green) and laminin (red; A), nkx6.1 (green) and laminin (red; B), or S100B (green; C) of cross‐sections performed in the middle region of the oSpC/decell muscle at 14 days after seeding. Nuclei were stained with Hoechst (blue). Scale bars = 50 μm. Dashed lines indicate the interface between scaffolds and oSpCs. D, Representative bright field images of oSpC cultured into Matrigel, cocultured with inert scaffolds or cocultured with decell muscles at 4 days after seeding. The insets show axon projections within the Matrigel droplet. Scale bars = 1 mm (left panel) and 100 μm (right panel). E, Quantification of neuronal projection directionality in oSpC section cultured in presence of Matrigel (green), of inert scaffold (red) or decell muscle (black) at 4 days after seeding. Data are shown as mean ± SEM of four independent replicates; multiple comparison one‐way ANOVA (analysis of variance) was used. ***P < .01 among all the experimental groups. F, Two‐photon live imaging of oSpC‐derived neural projection incorporating Calcein (green) that run within the Matrigel toward decell muscle identified with SHG (gray) at 14 days after seeding. The image shows neural projections sprouted from the central body of oSpC, which instead is out from the optical field. Scale bar = 200 μm. SHG, second‐harmonic generation
