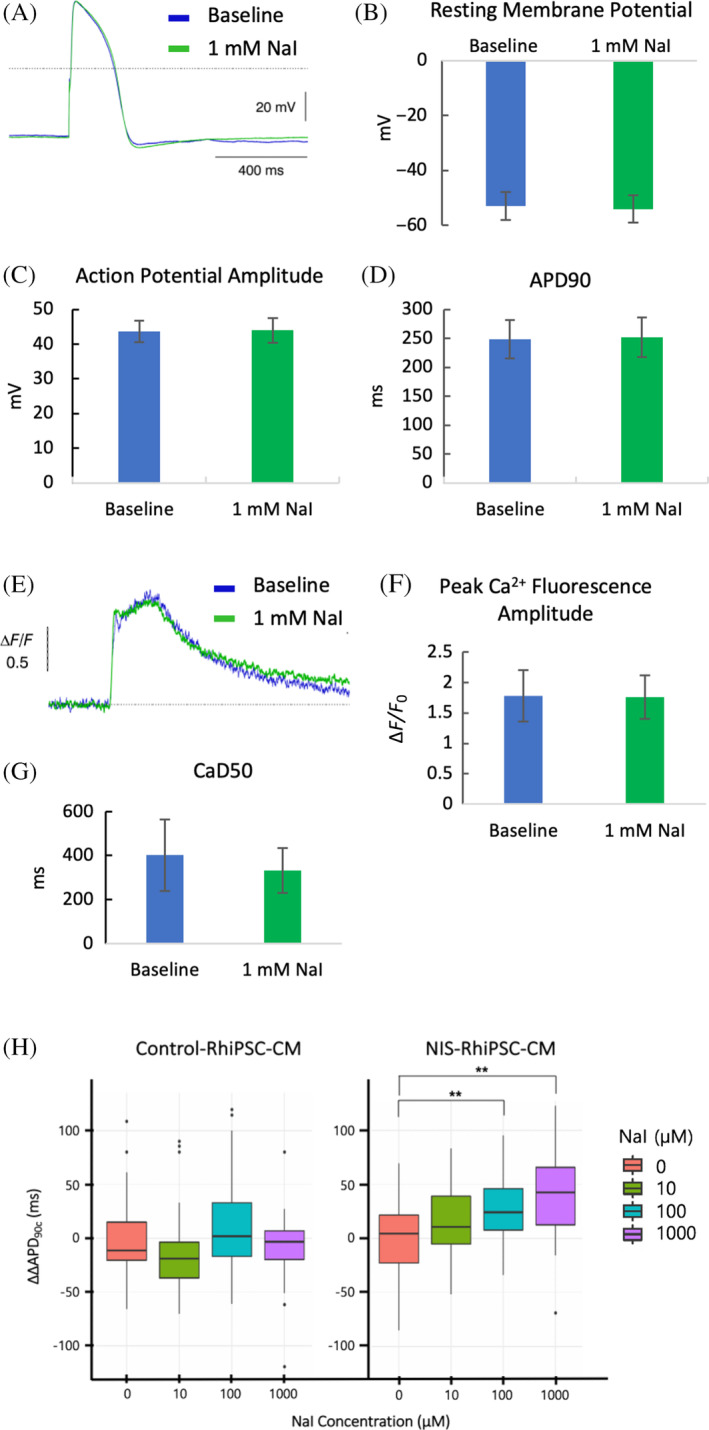
FIGURE 5.

Electrophysiological (EP) characteristics of NIS‐RhiPSC‐CMs after addition of sodium iodide (NaI). A, Representative AP tracings at pre‐exposure baseline (blue) and 3 minutes after addition of 1 mM NaI (green) in V‐type NIS‐RhiPSC‐CMs (n = 5). Images obtained via whole‐cell patch clamp. B‐D, Graphic representation of key EP parameters in NIS‐RhiPSC‐CMs, both before and during incubation with 1 mM NaI (n = 5), expressed as mean ± SEM. E, Representative Ca2+ transients at pre‐exposure baseline (blue) and 3 minutes after addition of 1 mM NaI (green) in V‐type NIS‐RhiPSC‐CMs (n = 3). F,G, Graphic representation of peak Ca2+ fluorescence and time to 50% Ca2+ fluorescence decay (CaD50) in NIS‐RhiPSC‐CMs, both before and during incubation with 1 mM NaI (n = 3), expressed as mean ± SEM. H, Optical imaging with voltage‐sensitive dyes revealed a progressive increase in ΔΔAPD90C in NIS‐RhiPSC‐CMs (n = 96) relative to baseline with escalating levels of NaI, becoming significant at 100 μM NaI and remaining significant at 1000 μM NaI. No significant deviations were observed in control RhiPSC‐CMs (n = 107) at any of the NaI levels assessed. Data are represented as box plots, wherein the middle line, box ends, and whiskers represent the median, first and third quartiles, and minimum and maximum values, respectively. Dots on either side of the whiskers are outliers. **P < .01. AP, action potential; RhiPSC‐CMs, rhesus macaque induced pluripotent stem cell‐derived cardiomyocytes
