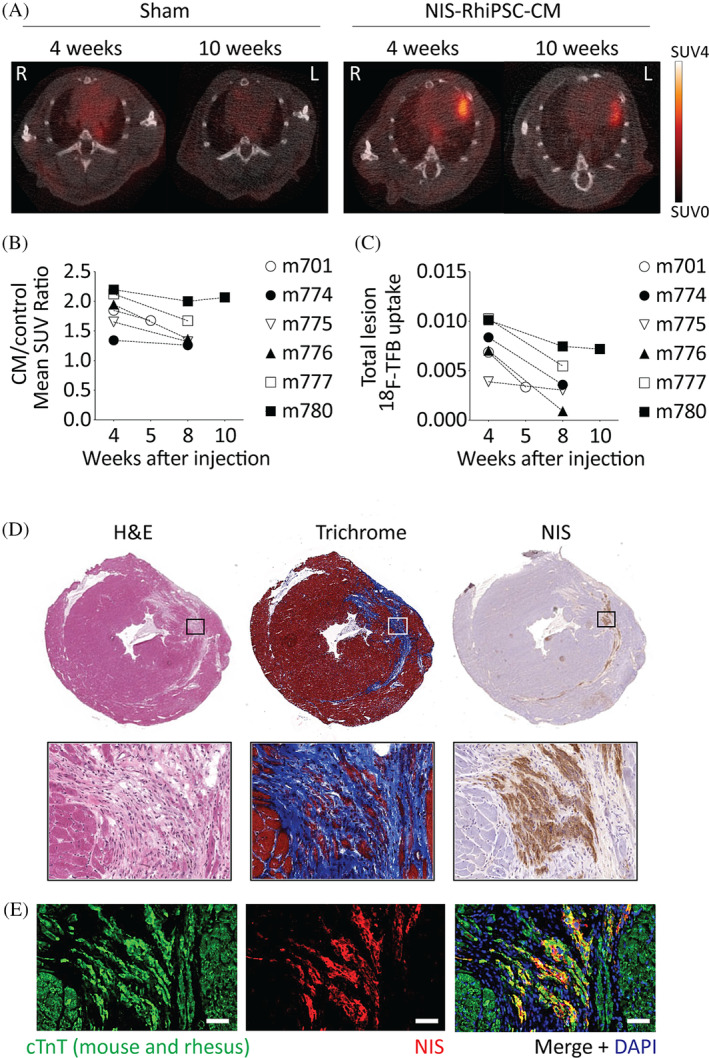
FIGURE 6.

Longitudinal in vivo tracking of NIS‐RhiPSC‐CMs by μPET/CT. A, Intramyocardial signals within the putative infarct zone can be readily visualized at both 4 and 10 weeks in the NIS‐RhiPSC‐CM injection animal (right) vs the sham vehicle injection animal (left). Representative PET/CT images are shown. Display settings shared by all images. B,C, Quantification 18F signals of implanted NIS‐RhiPSC‐CMs in PET‐positive animals over time. D, Histologic analysis of explanted PET‐positive hearts revealed small left anterior descending artery‐territory infarcts by H&E (left), shown more clearly by trichrome staining (middle). Immunostaining for NIS highlights engraftment of NIS+ cells throughout the infarct region (right) in this representative image. Images in top and bottom panels obtained at 40X and 320X, respectively. E, Costaining of NIS (red) and CTnT (green) confirmed engraftment of NIS‐RhiPSC‐CMs in infarct zone. CTnT is expressed in both mouse and rhesus cardiomyocytes. All images in (D, E) were obtained from the same injected mouse shown in panel (A), right. Scale bar = 50 μm. μPET, micro‐positron emission tomography; CT, computed tomography; RhiPSC‐CMs, rhesus macaque induced pluripotent stem cell‐derived cardiomyocytes
