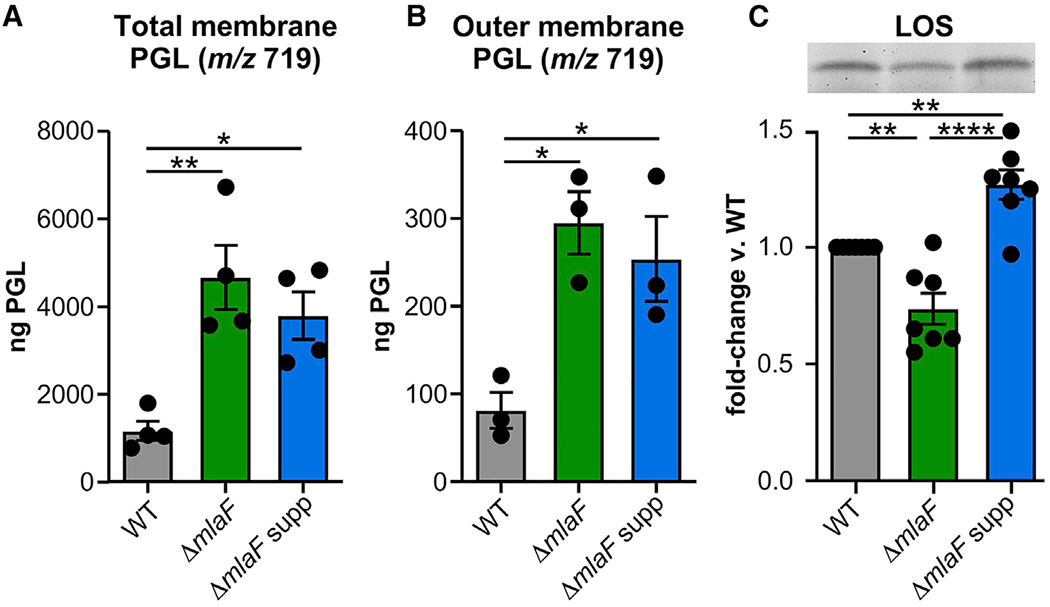
Figure 4. The Suppressor Strain Maintains Increased Phosphatidylglycerol Levels but Also Has Increased LOS.

(A and B) Phosphatidylglycerols (PGL) with mass-to-charge ratio (m/z) of 719 in total membrane (n = 4) and outer membrane fractions (n = 3).
(C) Fold-change in lipooligosaccharide (LOS) (n = 7 from 4 independent LOS extractions). Inset shows a representative gel. Data are means ± SEM; significance by one-way ANOVA with Tukey’s multiple comparisons. *p < 0.05, **p < 0.01, ***p < 0.001, ****p < 0.0001. See also Figure S4, Table S1, and Table S2.
