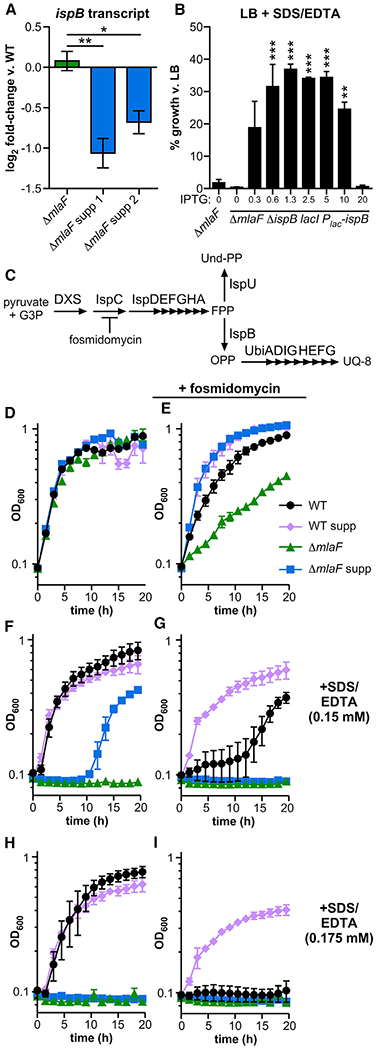
Figure 5. A Suppressor Insertion Lowers Expression of ispB and Increases Resistance to Membrane Stress.

(A) Transcript abundance of ispB in ΔmlaF and independently-isolated ΔmlaF suppressor strains 1 and 2 was measured using RT-qPCR (n = 3; significance by one-way ANOVA with Tukey’s multiple comparisons).
(B) ispB expression was induced by IPTG (mM) in the ΔmlaF lacI Plac-ispB strain and growth in 0.01% SDS and 0.175 mM EDTA was compared to growth in LB at 12 h (n = 2, representative of two independent experiments; significance by one-way ANOVA with Dunnett’s multiple comparisons to ΔmlaF).
(C) Schematic of isoprenoid biosynthesis.
(D–I) Representative growth curves of strains LB without (D, F, and H) and with (E, G, and I) 100 mg/L fosmidomycin, and without (D and E), and with (F and I) 0.01% SDS and EDTA at the concentration indicated (n = 3). Data are means ± SEM. *p < 0.05, **p < 0.01, ***p < 0.001. G3P, glyceraldehyde 3-phosphate; DXS, 1-deoxy-d-xylulose-5-phosphate synthase; Und-PP, undecaprenyl pyrophosphate; FPP, farnesyl pyrophosphate; UQ-8, ubiquinone-8. See also Figure S5.
