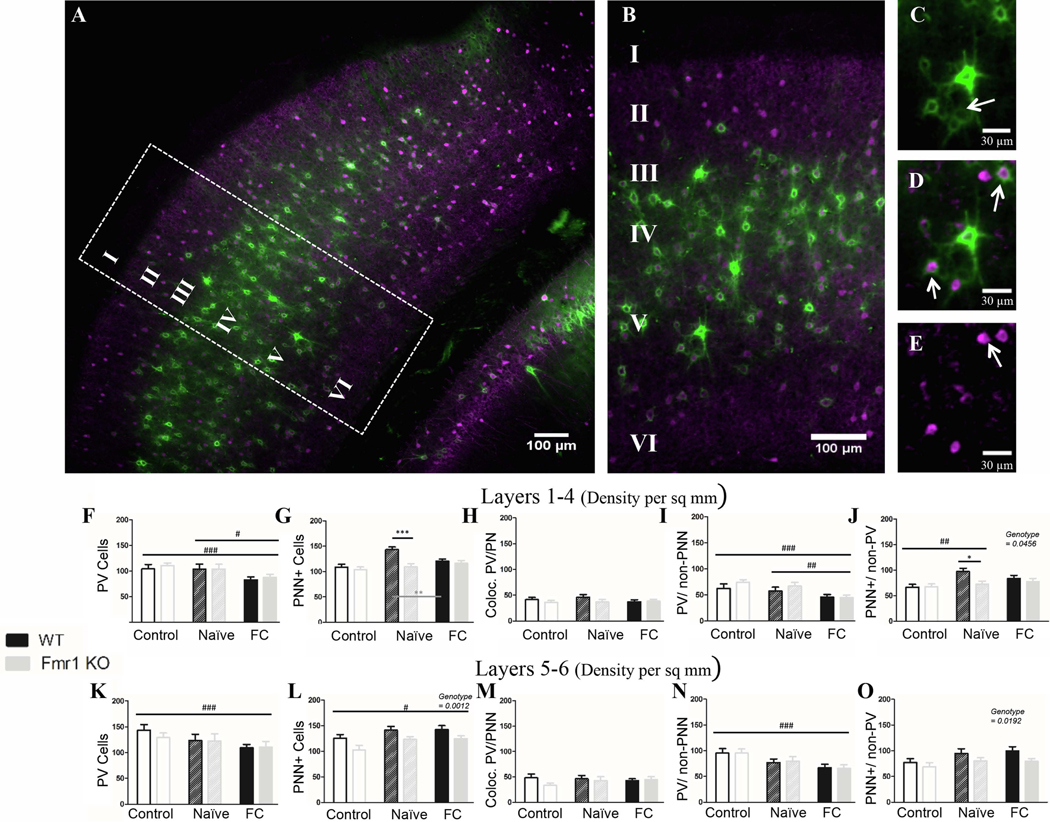
Figure 3. Fear conditioning causes reduced PV density across genotypes in auditory cortex, and dysregulation of PNNs in auditory cortex of Fmr1 KO mice.
A) Example image of WT naïve auditory cortex, with cropped image used for analysis (B). The far right panels identify examples of PNN surrounding non-PV cells (C; arrow), PV cells without PNN (E; arrow) and co-localized PV/PNN cells (D; arrow). F) Fear conditioning caused a decrease in PV density in both superficial (K) and deep layers, specifically in PV cells that were not surrounded by PNN (I; N). There was no genotype difference in PV cell density. L) There were overall fewer PNN cells in Fmr1 KO auditory cortex (deep layers), which were surrounding non-PV cells (O), but no difference was seen in PNNs which surround PV cells (H; M). In superficial layers WT mice up-regulate PNNs after naïve conditioning, and down-regulate them after fear conditioning, while Fmr1 KO mice show no change (G). Conditioning effect #, ##, ###; paired comparison *, **, *** (p = 0.05, 0.01, 0.001). N per group: WT Nv = 5; WT FrC = 5; WT C = 3, Fmr1 KO Nv = 6, Fmr1 KO FrC = 6, Fmr1 KO C = 5. Image # per group: WT Nv = 19, WT FrC = 18, WT C = 15, Fmr1 KO Nv = 18, Fmr1 KO FrC = 18, Fmr1 KO C = 18.

