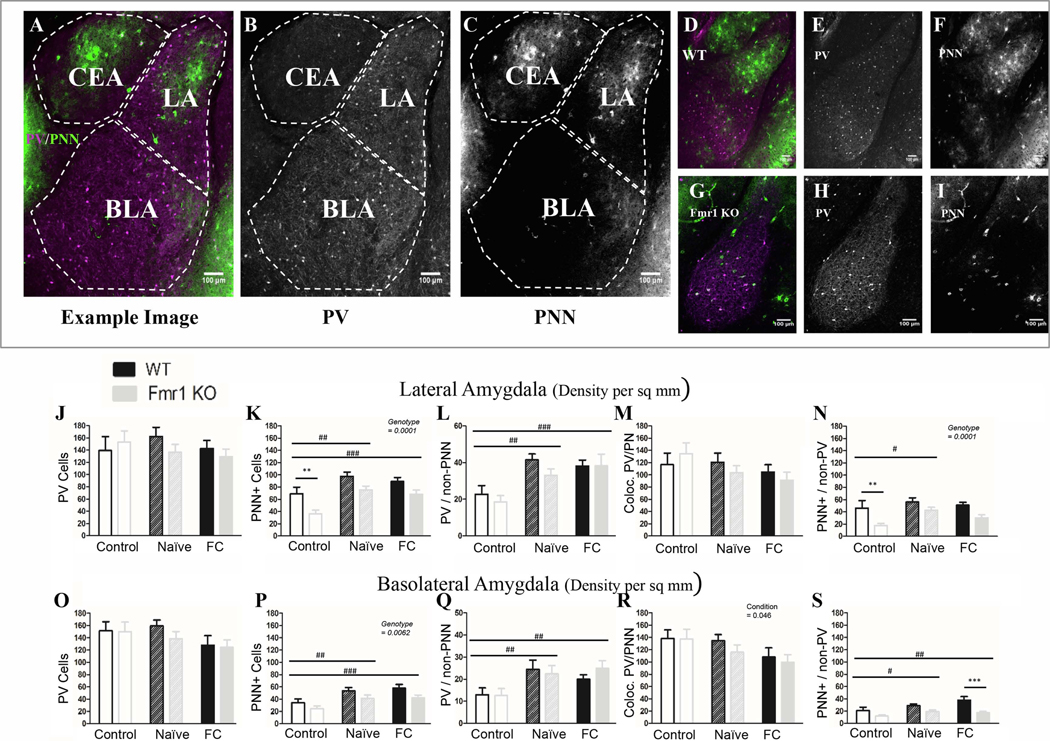
Figure 4: Fmr1 KO mice have less PNN in the amygdala than WT mice, but can still upregulate PNNs after conditioning.
A) Example image from a coronal section containing amygdala nuclei, including the lateral nucleus (LA), the basolateral nucleus (BLA) and the central nucleus (CEA). CEA was not identifiable in all slices and therefore was not counted. Area of each nucleus is determined using visible anatomic structures, gradation in cellular staining and the mouse Allan brain atlas. PV (B) and PNN (C) are shown to the right. D) Example image of a WT naïve slice and an (G) Fmr1 KO naïve slice, with PV (E; H) and PNN (F; I) to the right. Overall there are fewer PNNs in Fmr1 KO mice than WT in both LA (K) and BLA (P), specifically fewer PNNs surrounding non-PV cells (N; S). This genotype difference is not affected by conditioning. Both naïve and fear conditioned mice show an increase in PNNs across genotypes. J; O) While there was no difference in overall PV cell number either due to conditioning or to genotype, it seems that both the naïve exposure to the training protocol as well as full conditioning cause an increase in the number of PV cells that are surrounded by PNN (L; Q) probably due to increased overall PNN. At the same time there was a reduction in PV cells not surrounded with PNN after fear conditioning in the BLA (R) but not in the LA (M). Conditioning effect #, ##, ###; paired comparison *, **, *** (p = 0.05, 0.01, 0.001). N per group: WT Nv = 5; WT FrC = 6; WT C = 3, Fmr1 KO Nv = 6, Fmr1 KO FrC = 6, Fmr1 KO C = 4. Image # per group: WT Nv = 17, WT FrC = 17, WT C = 13, Fmr1 KO Nv = 17, Fmr1 KO FrC = 17, Fmr1 KO C = 17.

