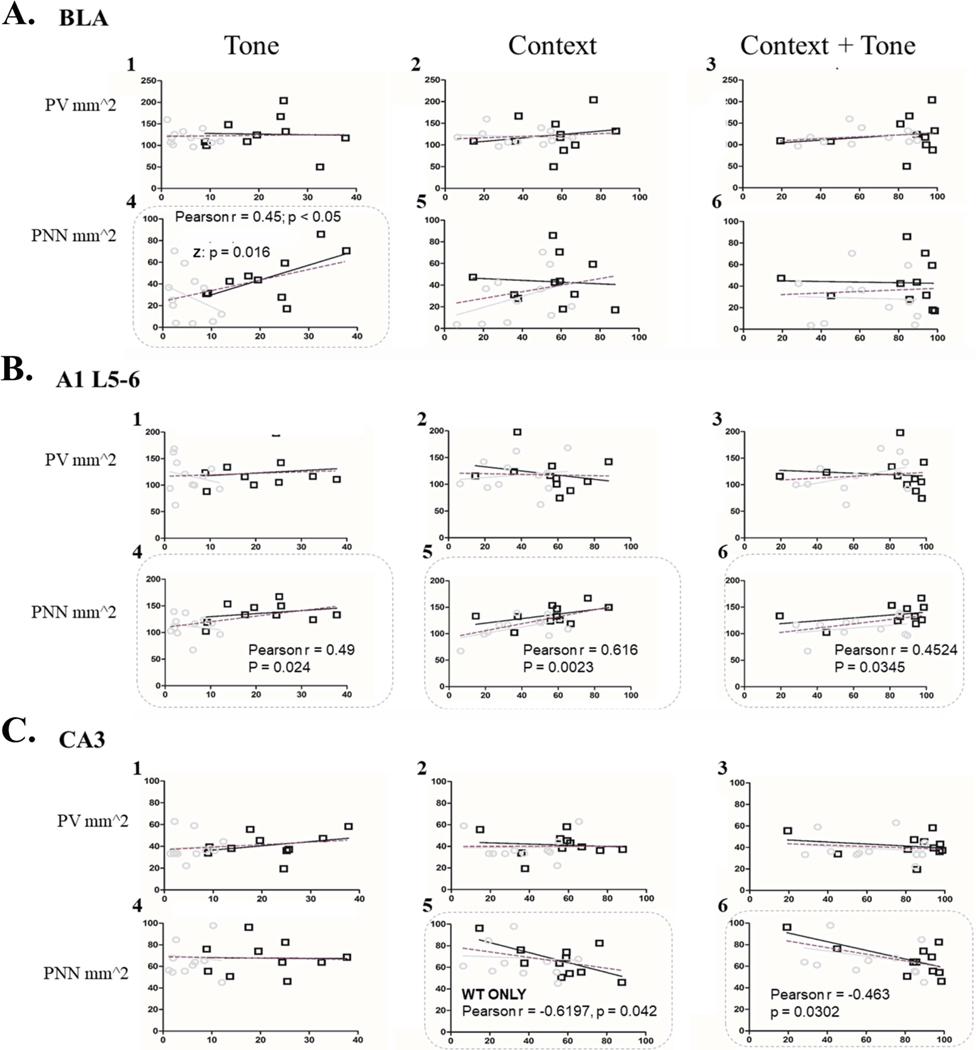
Figure 7: High PNN density is correlated with higher freezing behavior across multiple brain regions.
Panel A shows basolateral amygdala, Panel B deep layers of auditory cortex and Panel C shows CA3. Each column shows the correlation between an animal’s freezing during a recall test (Tone, Context or Context-with-Tone) and their levels of PV cell density (1–3) or PNN density (4–6). In both deep A1 and basolateral amygdala high freezing during tone recall was correlated with higher levels of PNN density. Additionally, in both deep A1 and CA3, high freezing during context or context-with-tone recall was correlated with high PNN levels. KEY: The grey line indicates Fmr1 KO regression curve, black line indicates WT regression curve, and the dotted line indicates the genotypes grouped. Pearson’s r indicates correlation when both genotypes are grouped. Z indicates the difference between the Pearson’s r values for WT and Fmr1 KO mice on a Z-scale.

