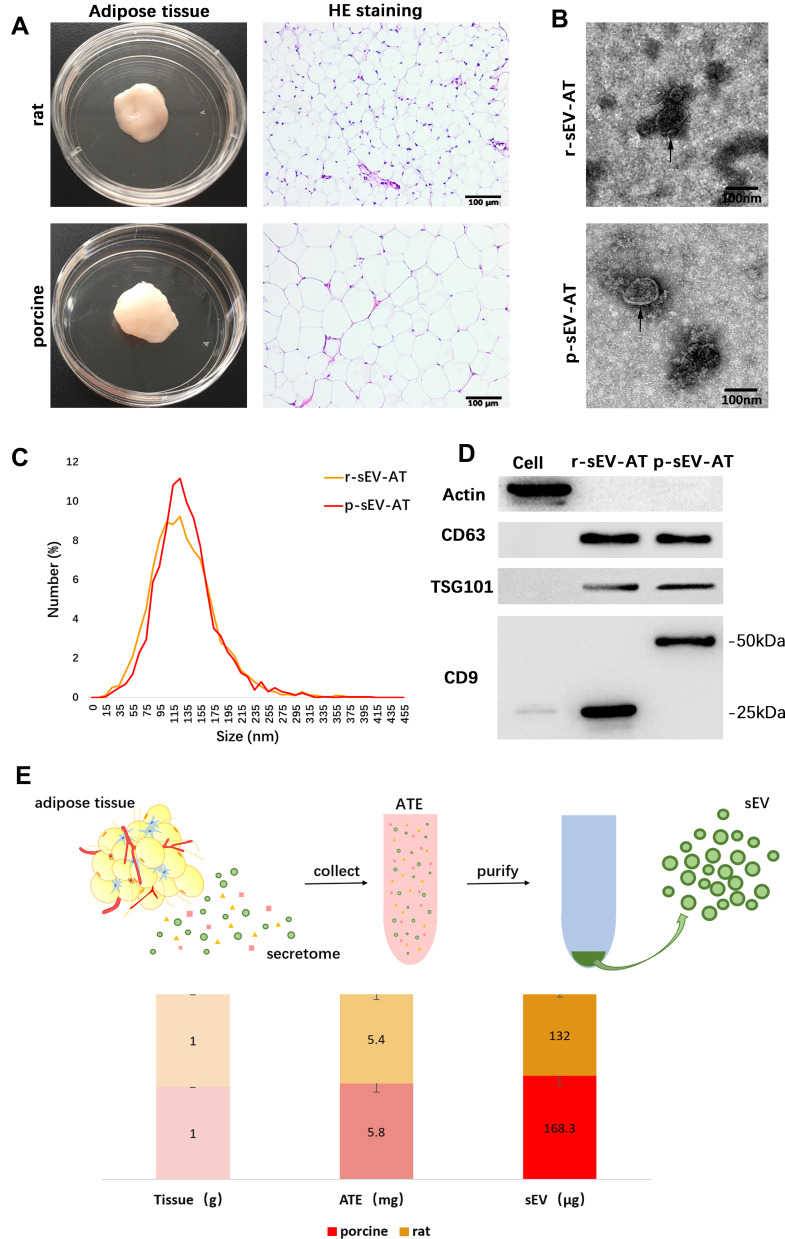
Figure 1.
Characterization of r-sEV-AT and p-sEV-AT. (A) Macro and H&E images of native rat and porcine adipose tissue. Scale bar = 100 μm. (B) The morphology of r-sEV-AT and p-sEV-AT was observed by transmission electron microscopy analysis. The black arrows pointed out the sEV-AT. Scale bar = 100 nm. (C) Size distribution of sEV-AT was measured by NanoSight analysis. (D) The expressions of Actin, CD63, TSG101 and CD9 in cell debris, r-sEV-AT and p-sEV-AT were detected by Western blot. (E) The amount of ATE and sEV-AT that could be isolated from 1 g native adipose tissue (n=3).
Abbreviations: ATE, adipose tissue extract; H&E, hematoxylin and eosin; p-sEV-AT, small extracellular vesicles derived from porcine adipose tissue; r-sEV-AT, small extracellular vesicles derived from rat adipose tissue; sEV, small extracellular vesicles; sEV-AT, small extracellular vesicles derived from adipose tissue.

