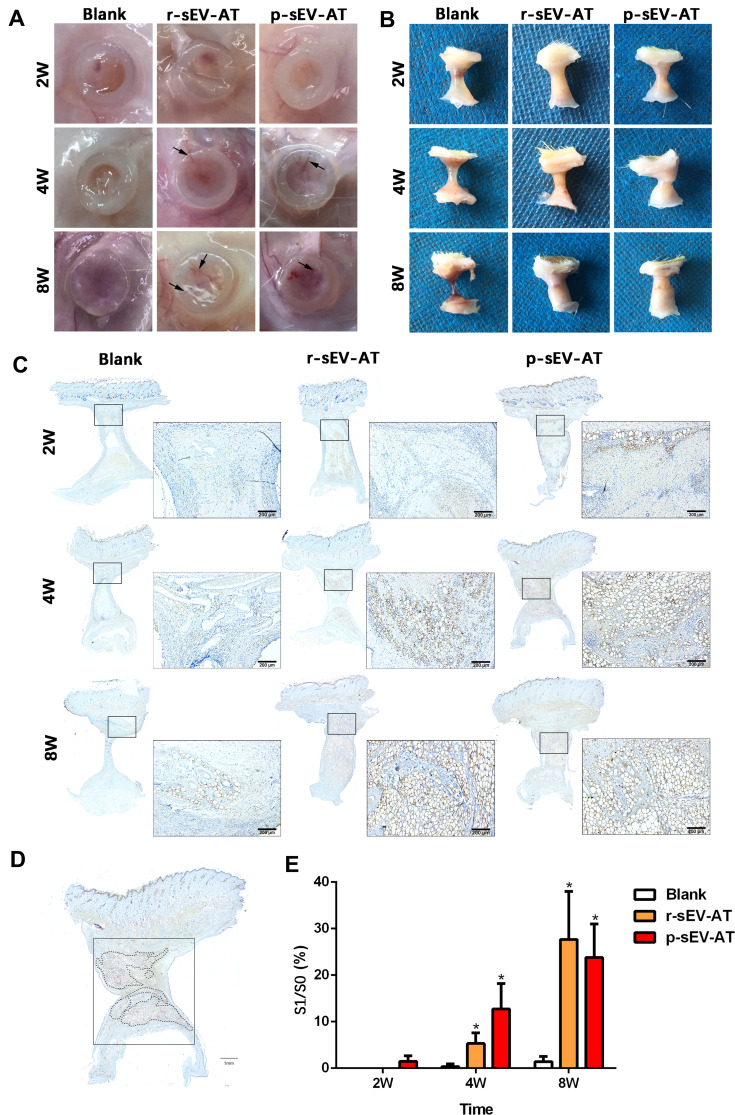
Figure 4.
Neoadipose tissue formation induced by xenogeneic and allogeneic sEV-AT in vivo. Macro images of the implants (A) with the tubes or (B) without the tubes in the blank, r-sEV-AT and p-sEV-AT groups at 2W, 4W and 8W. The black arrows pointed out the blood vessels. (C) Immature and mature adipocytes were confirmed by immunohistochemical staining (stained with adipocyte marker, perilipin A). Scale bar = 200 μm. (D) Selected sections represented the center of the implants, the dotted line represented the area of neoadipose tissue (S1), the solid line represented the longitudinal section area of the silicone tube (S0), and S1/S0 represented the proportion of the neoadipose tissue in the silicone tube. (E) The average of S1/S0 in different groups (n=3). The significance was tested with one-way ANOVA with Tukey posthoc test (*p<0.05).
Abbreviations: p-sEV-AT, small extracellular vesicles derived from porcine adipose tissue; r-sEV-AT, small extracellular vesicles derived from rat adipose tissue; sEV-AT, small extracellular vesicles derived from adipose tissue.

