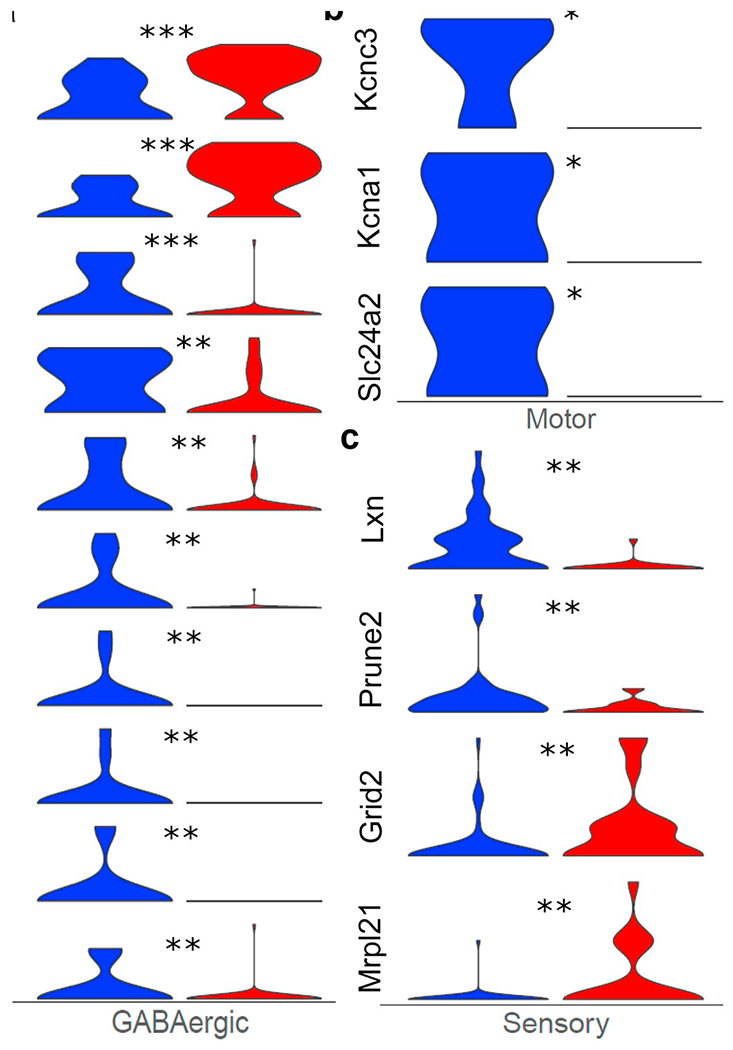
Fig. 4.

Expression change of select DEGs (wildtype cells in blue and mutant ones in red) in GABAergic, motor and sensory neurons. The stars above the violin plots represent the significance in gene expression changes: *0.01 < p value < .05; **0.001 < p-value < .01; *** p-value <.001. a) Expression changes of DEGs related to synaptic signaling in GABAergic neurons. b) Expression changes of DEGs related to potassium channel function in Motor neurons. c) Expression changes of top DEGs in the peripheral sensory neurons. (For interpretation of the references to colour in this figure legend, the reader is referred to the web version of this article.)
