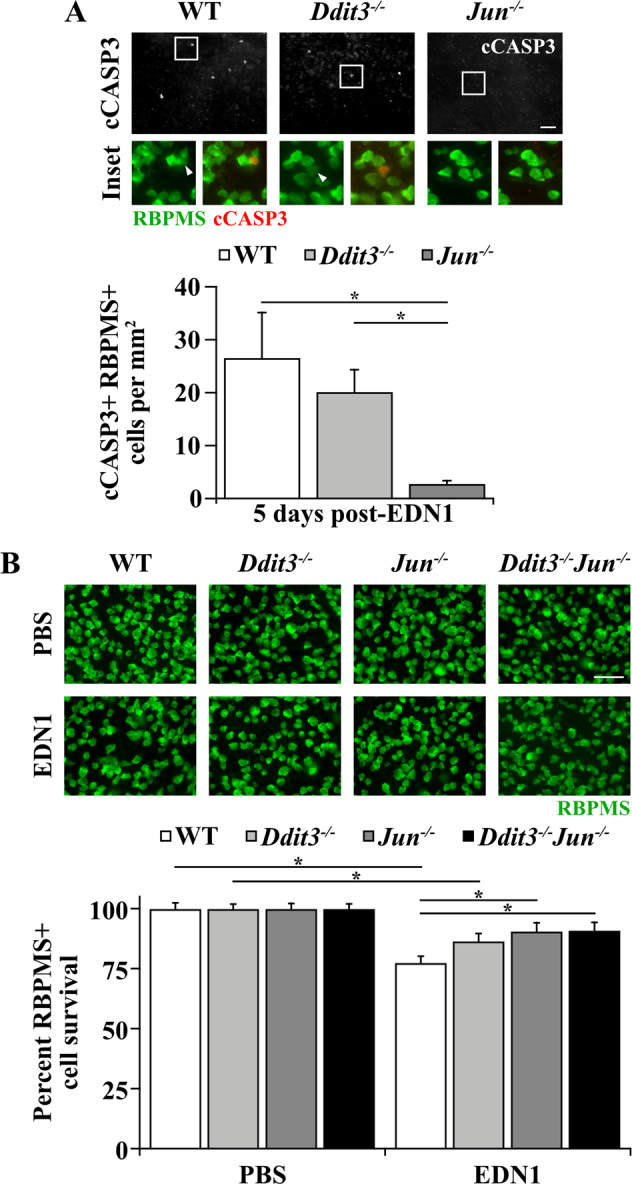
Fig. 3. EDN1-induced RGC death was JUN-dependent.

a Caspase 3 activation (cleavage, cCASP3, red) in RBPMS+ RGCs (green) 5 days post-EDN1 in WT, Ddit3−/−, and Jun−/− RGCs. Caspase 3 activation was not significantly lessened in Ddit3−/− RGCs compared to WT (P > 0.999), and Jun deletion from RGCs with Six3-cre significantly attenuated caspase 3 activation in RGCs compared to WT (*P < 0.001) and Ddit3−/− retinas (*P = 0.004). cCASP3+ RGCs/mm2 ± SEM for WT, Ddit3−/−, Jun−/−, respectively: 26.6 ± 8.6; 20.1 ± 4.2; 2.8 ± 0.6; n ≥ 7 per genotype, *P < 0.001, Kruskal–Wallis test, Dunn’s post hoc. Note: bottom row images depict RBPMS immunofluorescence (left image, green) and RBPMS/cCASP3 merged immunofluorescence (right image, green and red respectively) from the boxed area of the above image. Arrowheads indicate an RBPMS+ cCASP3+ cell. b %RBPMS+ (green) RGC survival in WT, Ddit3−/−, Jun−/−, and Ddit3−/−Jun−/− retinas 28 days post-PBS or EDN1. Both WT and Ddit3−/− retinas had significant RGC loss 28 days post-EDN1 insult compared to corresponding PBS-injected controls, while Jun−/− and Ddit3−/−Jun−/− retinas did not have significant RGC loss (WT: *P < 0.001; Ddit3−/−: *P = 0.012; Jun−/−: P = 0.139; Ddit3−/−Jun−/−: P = 0.244). Jun−/− retinas had significantly more surviving RGCs after EDN1 compared to WT (*P = 0.015). Ddit3−/−Jun−/− RGCs were also significantly protected from EDN insult compared to WT (*P = 0.022), but Ddit3−/−Jun−/− RGCs did not have significantly more protection than did Jun−/− RGCs (P > 0.999). %RGC survival ± SEM for WT, Ddit3−/−, Jun−/−, Ddit3−/−Jun−/−, respectively: PBS: 100.0 ± 2.4, 100.0 ± 1.9, 100.0 ± 2.2, 100.0 ± 2.0; EDN1: 77.5 ± 2.7, 86.5 ± 3.2, 90.6 ± 3.5, 90.9 ± 3.3; n ≥ 12 per genotype per condition. Data were analyzed using a two-way ANOVA with Holm-Sidak’s post hoc test. Note: in some EDN1-injured retinas, caspase 3 activation in RGCs and RGC loss were localized to portions of retina and was not necessarily diffuse throughout the entire retina. Images represent the average cell count for each condition. Error bars, SEM. Scale bars, 50 μm.
