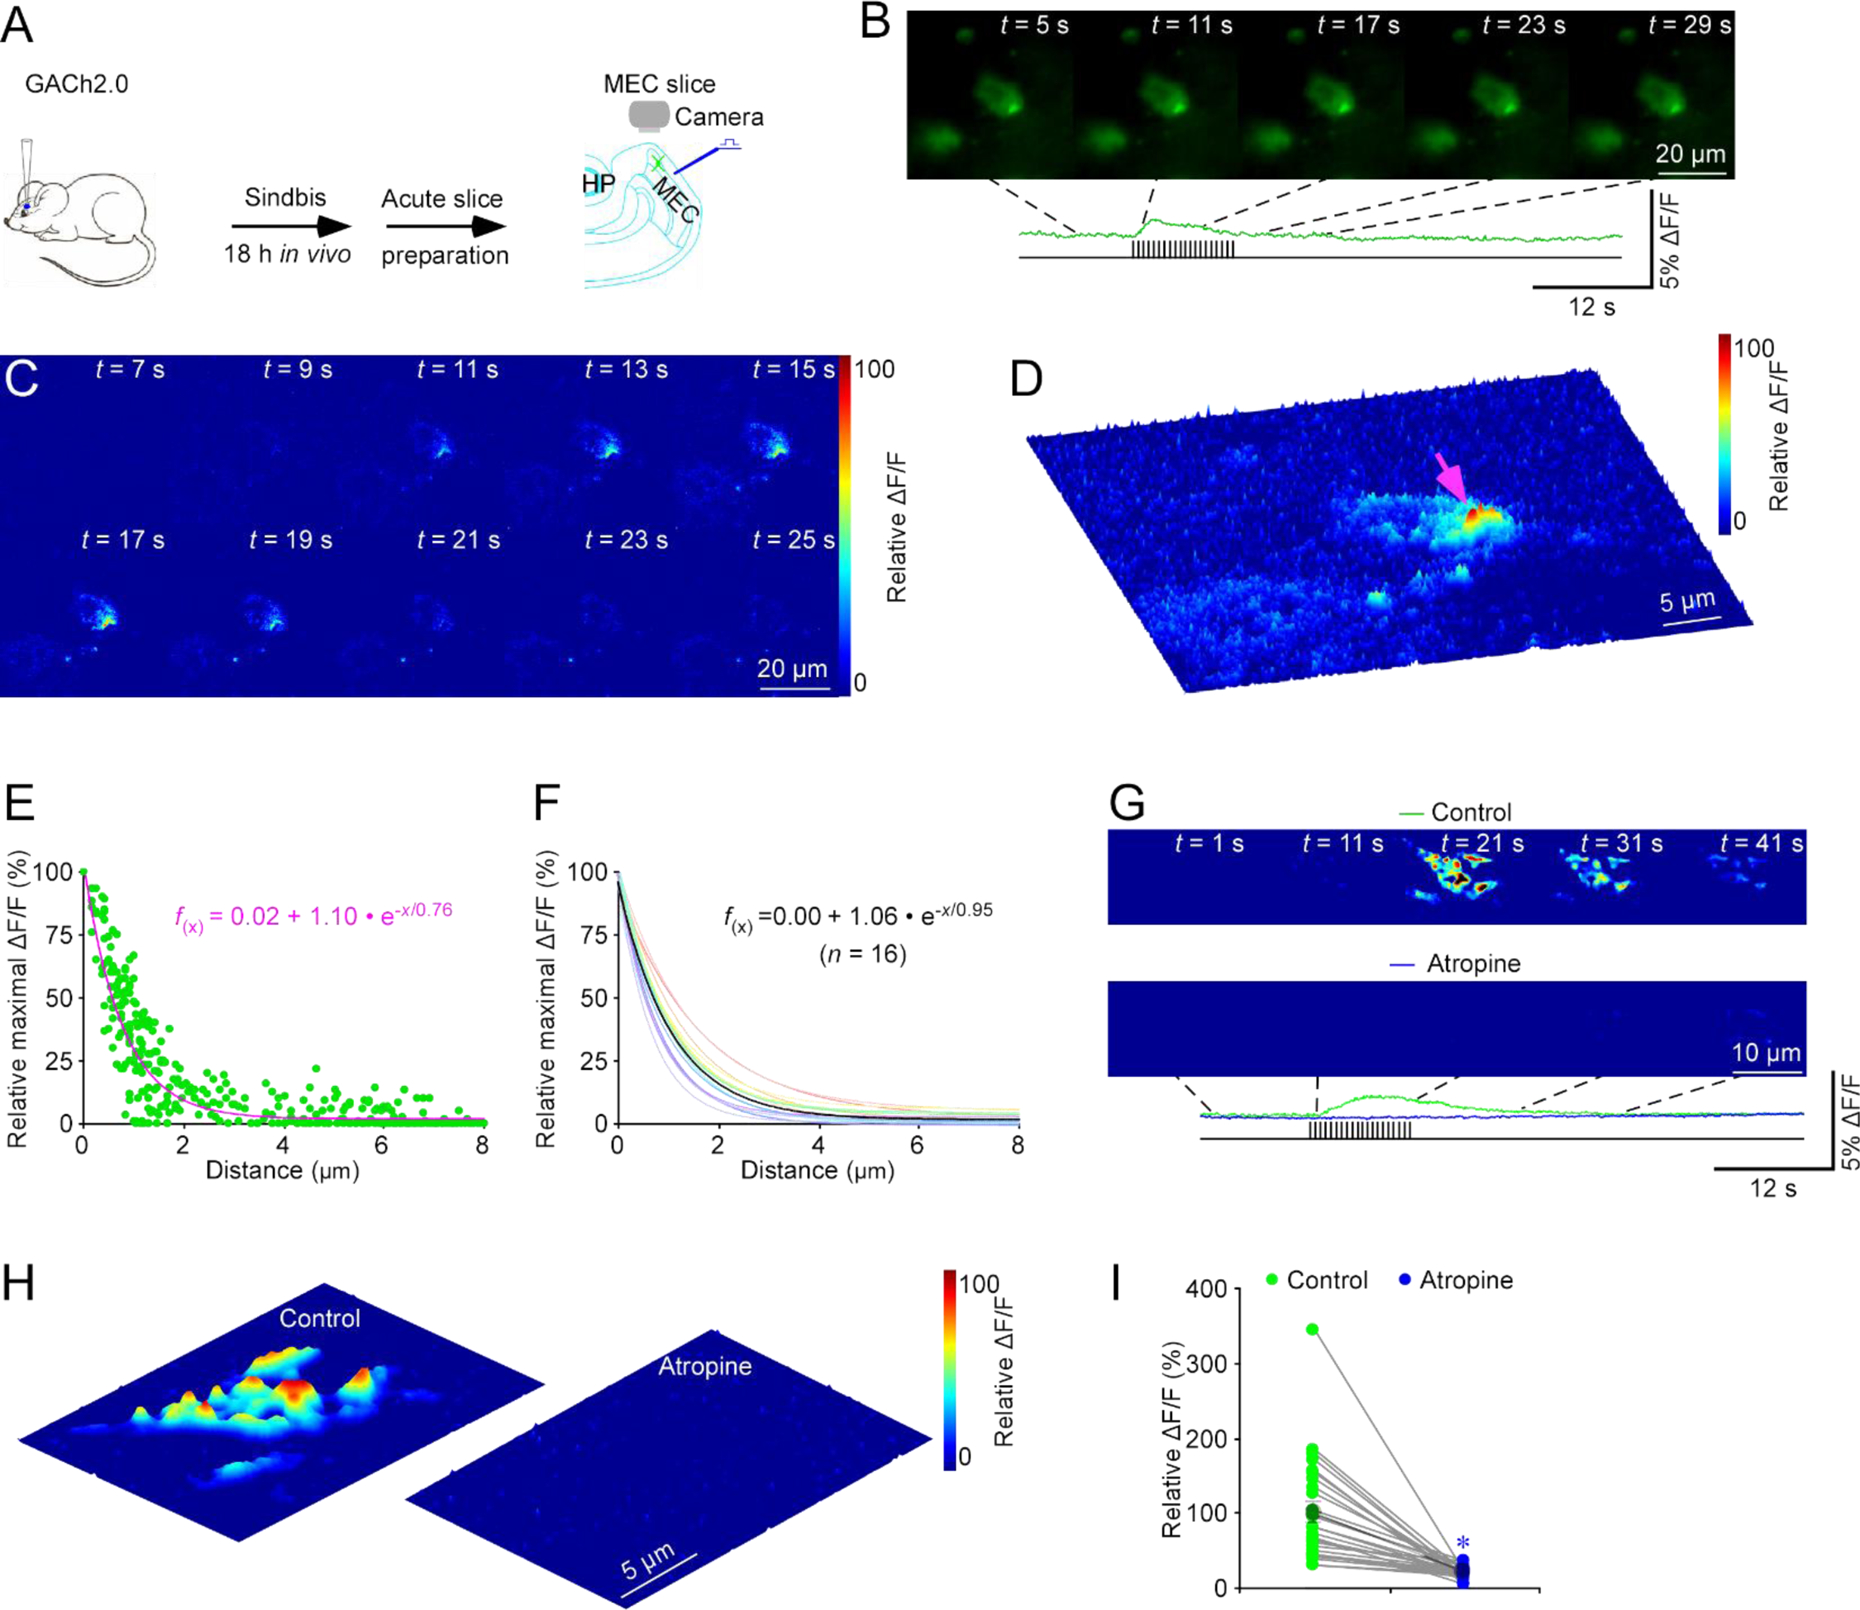
Figure 1. GACh2.0 spatiotemporally profiles cholinergic transmission at MEC stellate neurons.

(A) Schematic drawing of the design of stimulation-imaging experiments in acute mouse MEC slices. HP: Hippocampus; MEC: Medial entorhinal cortex.
(B-D) Snapshots of fluorescence ΔF/F responses (B), heatmap displays of time-dependent spatial ΔF/F responses (C) and three-dimensional spatiotemporal ΔF/F profiling (D) of a GACh2.0 expressing entorhinal stellate cell in response to local electrical stimuli. Note one isolated release site indicated by pink arrow in D.
(E) Plot of relative maximal ΔF/F of each pixel against its distance to the pixel with largest maximum ΔF/F at the isolated release site indicated by pink arrow in D. Fitting the data points in this plot with a single exponential decay function (pink line) yields an estimated ACh spread length constant of 0.76 μm.
(F) Summary plot of volume spread length constants obtained from putative single release sites and the average volume spread length constant of 0.95±0.07 μm for cholinergic transmission at entorhinal stellate neurons (n = 16 from 6 neurons from 5 animals). Note the average single exponential decay function fitting curve in black.
(G) Heatmap snapshots of time-dependent spatial ΔF/F responses of a GACh2.0 expressing entorhinal stellate neuron in response to local electrical stimuli in the normal bath solution and bath solution containing 10 μM atropine.
(H) Heatmap displays of three-dimensional spatiotemporal ΔF/F profiling of the same GACh2.0 expressing entorhinal stellate neuron in response to local electrical stimuli in the normal bath solution and bath solution containing atropine.
(I) Values of peak ΔF/F responses of putative single release sites measured in the normal bath solution and bath solution containing atropine (Control: 100.0±13.1%; Atropine: 21.5±1.5%; n = 27 from 6 neurons from 6 animals; Z = −4.541, p < 0.005). Large gray dots indicate average responses and asterisk indicates p < 0.05 (Wilcoxon Rank Sum test).
