
Figure 3.
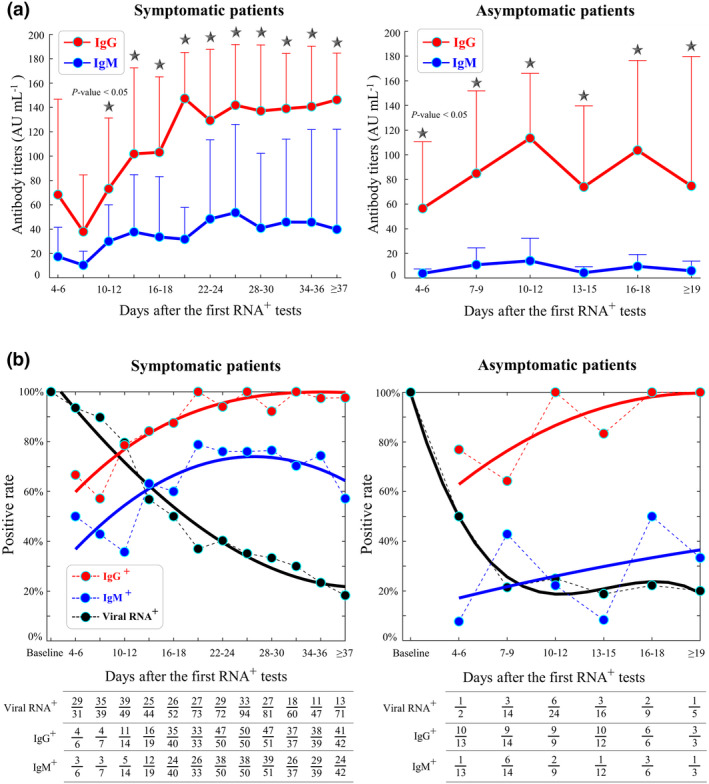
Dynamics of immunoglobulin G (IgG)/immunoglobulin M (IgM) and viral RNA during disease progression. (a) Mean and standard deviations of IgG and IgM titres in symptomatic (left) and asymptomatic (right) patients. A black star indicates a significant difference between IgG and IgM titres (P‐value < 0.05) at a sampling period of every three days. According to our clinical practice, serum samples at the first virus‐positive screening were not collected. (b) Positive rates of IgG seroconversion (red), IgM seroconversion (blue) and virus‐positive cases (black) in symptomatic patients (left) and asymptomatic patients (right). The table summarises the number of tested samples and positive results every 3 days. The polynomial fitting of positive rates is shown by the coloured curves. The x‐axis indicates the timeline from the first virus‐positive screening to the time point of IgG/IgM tests or viral RNA tests. Positive rates in the asymptomatic group were variable because of the small patient cohort (N = 26).