
Figure 4.
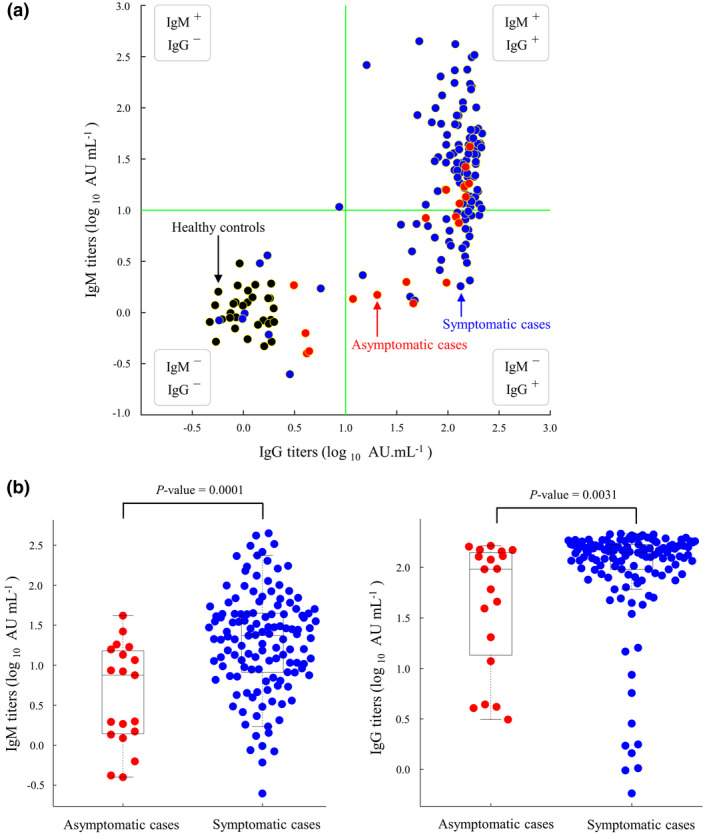
Plots of immunoglobulin G (IgG) and immunoglobulin M (IgM) titres measured at the time points of virus clearance. (a) Scatter plots of IgG and IgM titres in asymptomatic cases (red, N = 26), symptomatic cases (blue, N = 188) and healthy controls (black, N = 30). Green lines indicate cut‐offs of IgG and IgM at 1 log10 AU mL−1. IgG/IgM titres were measured at the time of virus clearance. (b) Box plots of IgM (left) and IgG (right) titres in asymptomatic and symptomatic patients.