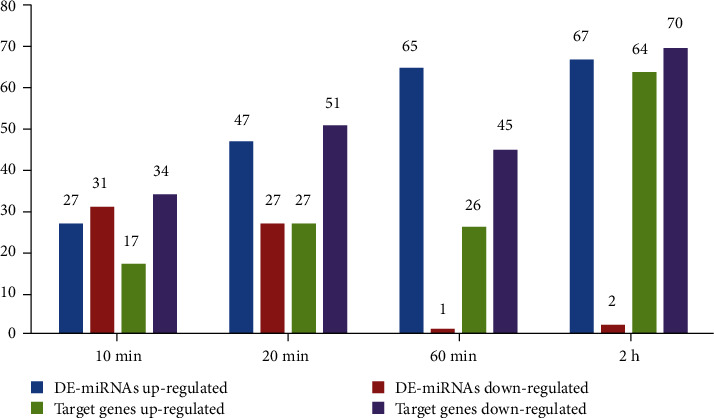
Figure 3.

Numbers of high-confidence target genes and their DE-miRNAs at the time points of 10 min, 20 min, 60 min, and 2 h after the heat treatment. The horizontal axis represents the time after the heat treatment, and the vertical axis represents the number of up- and downregulated probes.
