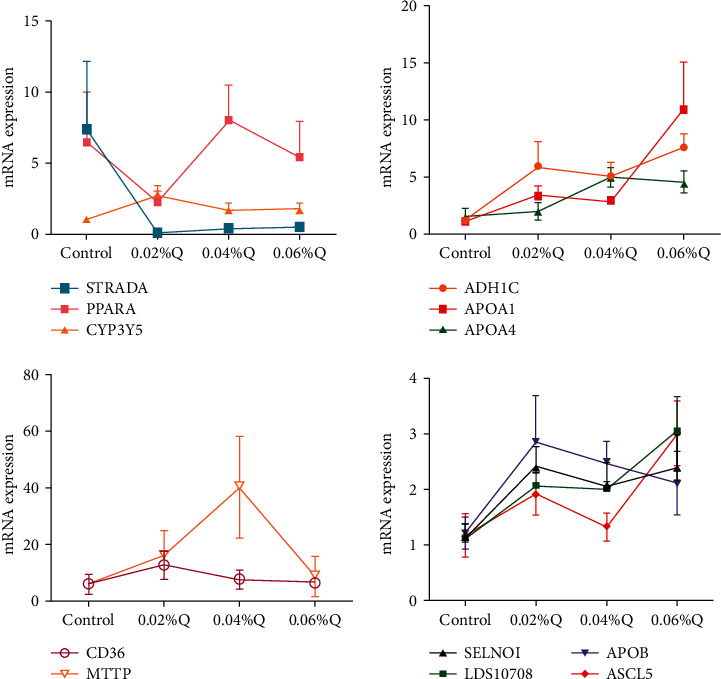
Figure 4.

Effects of quercetin on content and mRNA expression of enzymes associated with lipid metabolism in ileal mucosa. Note. (1) The results of relative quantification are expressed as 2−ΔΔCT. The quantification of control is 1, namely 2−ΔΔCT = 1. The value 2−ΔΔCT of the treatment group is a multiple of control. n = 6. (2) Mean values without a common letter are significantly different, P < 0.05. Values are mean ± SEM (n = 6). 0.02%Q, 0.04%Q, and 0.06%Q mean 0.02% quercetin, 0.04% quercetin, and 0.06% quercetin, respectively.
