
Figure 2.
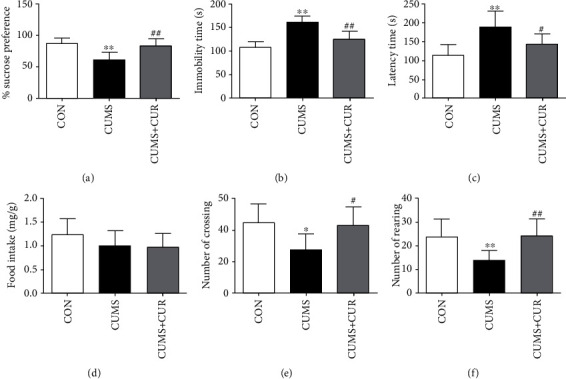
Effect of CUR on CUMS-induced behavior changes. (a) Sucrose preference in SPT, (b) immobility time in FST, (c) latency time in NSFT, (d) food intake in NSFT, (e) number of crossing in OPT, and (f) number of rearing in OPT. Data are expressed as means ± SD (n = 8). ∗p < 0.05 and ∗∗p < 0.01 compared to the control group. #p < 0.05 and ##p < 0.01 compared to the CUMS group.