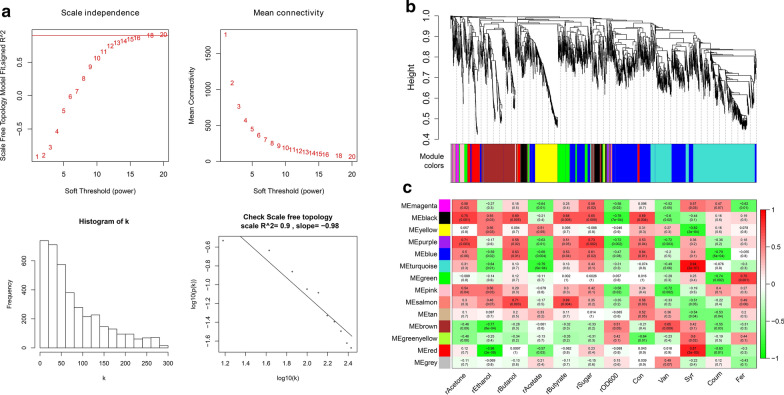
Fig. 2.
Construction of the WGCNA model. a Network topology analysis for adjacency matrices with different soft threshold powers. Red numbers indicate the soft‐threshold power corresponding to the correlation coefficient square value and mean connectivity. The linear model fit (R2) between log(p(k)) and log(k) was calculated from each adjacency matrix, where k = the connectivity and p(k) = the proportion of genes with connectivity k. b Clustering dendrogram of all expressed genes. Each row corresponds to a module eigengene and each column to a fermentation phenotype. c Module-traits relationships identified by WGCNA. Each cell contains the corresponding correlation in the first line and the p-value in the second line. Modules are colored as in the legend. Green and red denote negative and positive correlations, respectively. The grey module represents a collection of genes that could not be grouped into other modules

