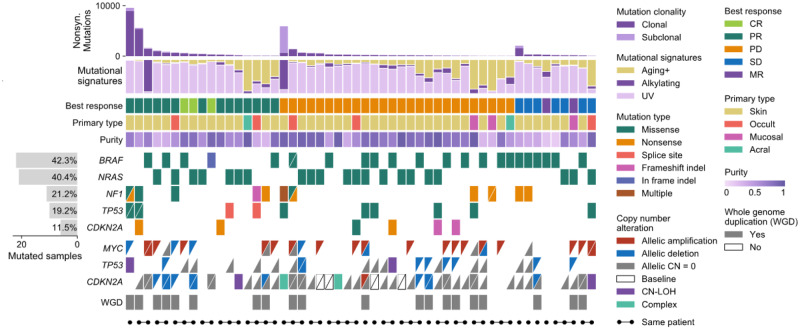
Fig. 1.
A comutation plot generated with CoMut using data provided in the study by Liu et al. (2019). For visualization purposes, only 52 samples are shown. Each column represents a tumour. Tumours are ordered by best RECIST criteria response (CR, PR, PD, SD or MR) and within each subgroup by non-synonymous mutation load. For copy number data, each triangle represents one allele and allele-specific copy number alterations are classified relative to baseline ploidy (2 if sample has whole genome duplication, 1 otherwise). Unfilled boxes with a slash indicate that allelic copy number data was unavailable due to too few heterozygous SNP sites. Complex indicates that a segment breakpoint occurred within a gene, creating conflicting copy number. CN-LOH indicates copy neutral loss of heterozygosity. Sample indicators are added for demonstration purposes and do not represent data from the study.

